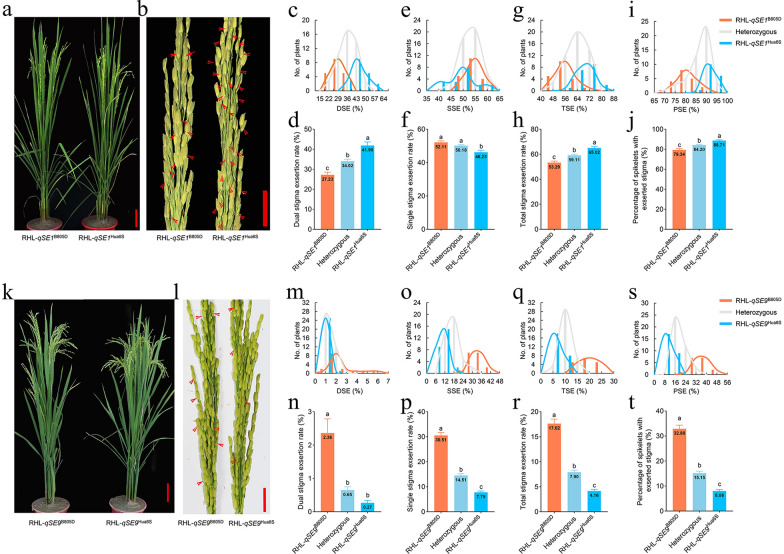
Fig. 1.
The phenotype of RHLs for qSE1 and qSE9. Plant type of RHL-qSE1B805D and RHL-qSE1Hua6S (a), RHL-qSE9B805D and RHL-qSE9Hua6S (k) at heading stage. Scale bar, 10 cm. Panicle of RHL-qSE1B805D and RHL-qSE1Hua6S (b), RHL-qSE9B805D and RHL-qSE9Hua6S (l). The red arrows pointed to exserted stigmas. Scale bar, 2 cm Frequency distribution of dual stigma exsertion rate (DSE) (c, m), single stigma exsertion rate (SSE) (e, o), total stigma exsertion rate (TSE) (g, q), percentage of spikelets with exserted stigma (PSE) (i, s) in the RHL population. Comparison of DSE (d, n), SSE (f, p), TSE (h, r), and PSE (j, t) in the RHL population. Different letters indicated significant differences at p < 0.05 (one-way analysis of variance followed by Tukey’s multiple-comparison test)

