Fig. 5.
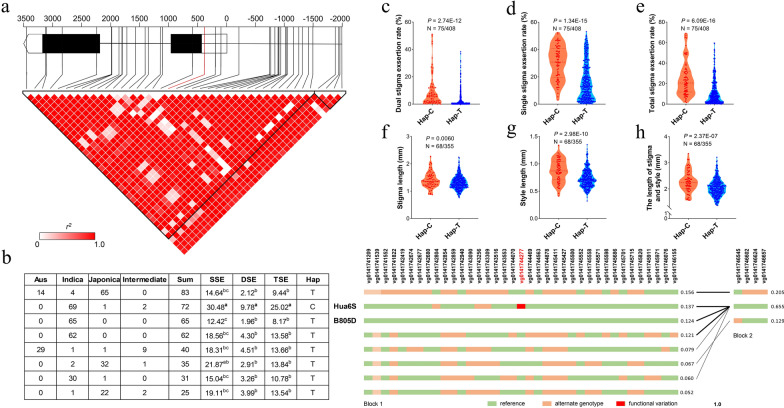
Haplotype analysis of the candidate gene LOC_Os01g72020 (OsBOP1). a Gene structure and linkage disequilibrium (LD) display of OsBOP1. The predicted functional variation (marked in red) was observed within the 5’UTR of OsBOP1. The color scheme represented the LD relationships between DNA polymorphisms, based on r2 values. Two triangles indicated the two haplotype blocks divided by software Haploview. b Haplotypes of OsBOP1 in the rice core germplasm collection were depicted on the left panel. Different letters indicated significant differences among phenotypic values at p < 0.05 (one-way analysis of variance followed by Tukey’s multiple-comparison test). Variation information was displayed on the right panel. Variation IDs from website RiceVarMap2 were shown on the top (Zhao et al. 2014), with the predicted functional variation highlighted in red. Block1 and 2 correspond to the two triangles in (a). c–h Phenotypic comparison between two haplotypes for dual stigma exsertion rate (DSE) (c), single stigma exsertion rate (SSE) (d), total stigma exsertion rate (TSE) (e), stigma length (f), style length (g), the length of stigma and style (h). p value was calculated based on two-tailed Student’s t tests

