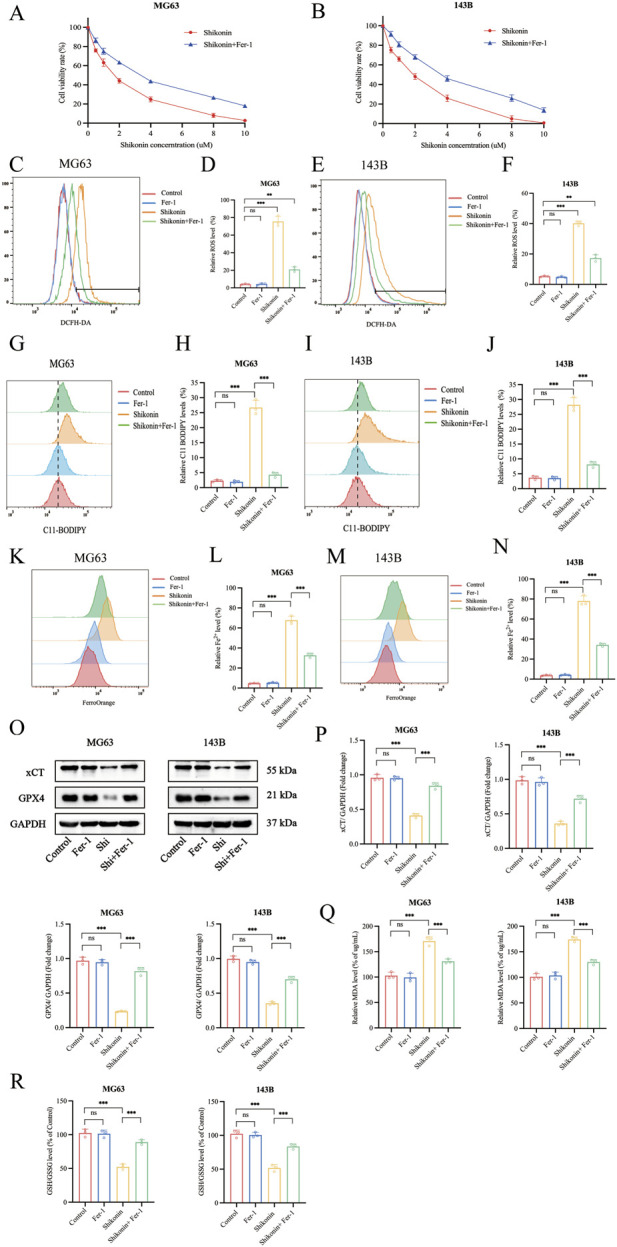
FIGURE 2.

Shikonin triggered the ferroptosis in OS cells. (A, B) The MG63 and 143B cells were co-treated with shikonin and Fer-1 after 24 h, and the cell viabilities were examined by CCK-8 assay. (C–F) The ROS, (G–J) lipid peroxidation and (K–N) Fe2+ contents were performed by Flow cytometry, followed by quantitative analysis. (O, P) Western blot was used to detect the expression of protein xCT and GPX4, and quantification was analyzed. The levels of MDA (Q) and GSH/GSSG (R) were determined in the shikonin treated OS cells. *p < 0.05, **p < 0.01, ***p < 0.001. The data were presented as mean ± SD, and analyzed using one-way ANOVA following Tukey’s t-test (n = 3).
