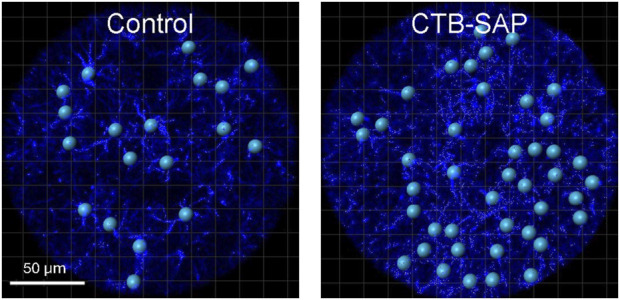
FIGURE 4.

Representative images of the morphological analysis of astrocytes (GFAP; blue) in the phrenic motor nucleus from C4 cervical spinal cord segments from a control and CTB-SAP rat using IMARIS software. Images taken of C4 cervical spinal cord segments were used to make z-stacks and rendered into 3D models of GFAP (blue) labelled astrocytes. The surface feature was used to generate the phrenic motor nucleus region of interest which was used to specifically separate values outside and inside the phrenic motor nucleus through a masking process. The filament feature was used to render the 3D models by placing starting points (blue spheres) at the center of each astrocyte and seed points (small white spheres) along astrocyte projections that were used to trace each filament. Following filament creation, astrocyte models were quantified inside and outside the phrenic motor nucleus. The resulting data was processed for filament and branch length and volume (e.g., the closer the seed points are to the starting point, the shorter the projections are from the cell body of the astrocyte, which demonstrates a reactive morphological state), and a Sholl analysis was performed using an algorithm written in Visual Studio Code to determine the number of intersections and intersection distance (see Table 2).
