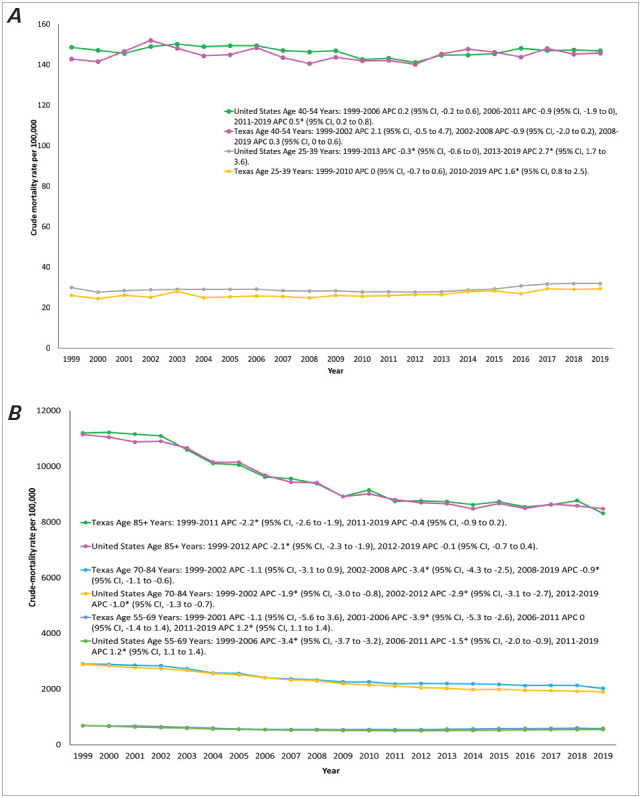
Fig. 5.

A) Cardiovascular disease–related mortality rates, stratified by age group, in Texas and the United States, 1999 to 2019. B) Cardiovascular disease–related mortality rates, stratified by age group, in Texas and the United States, 1999 to 2019.
*Indicates that the annual percentage change (APC) is statistically significantly different from zero at α = .05.
