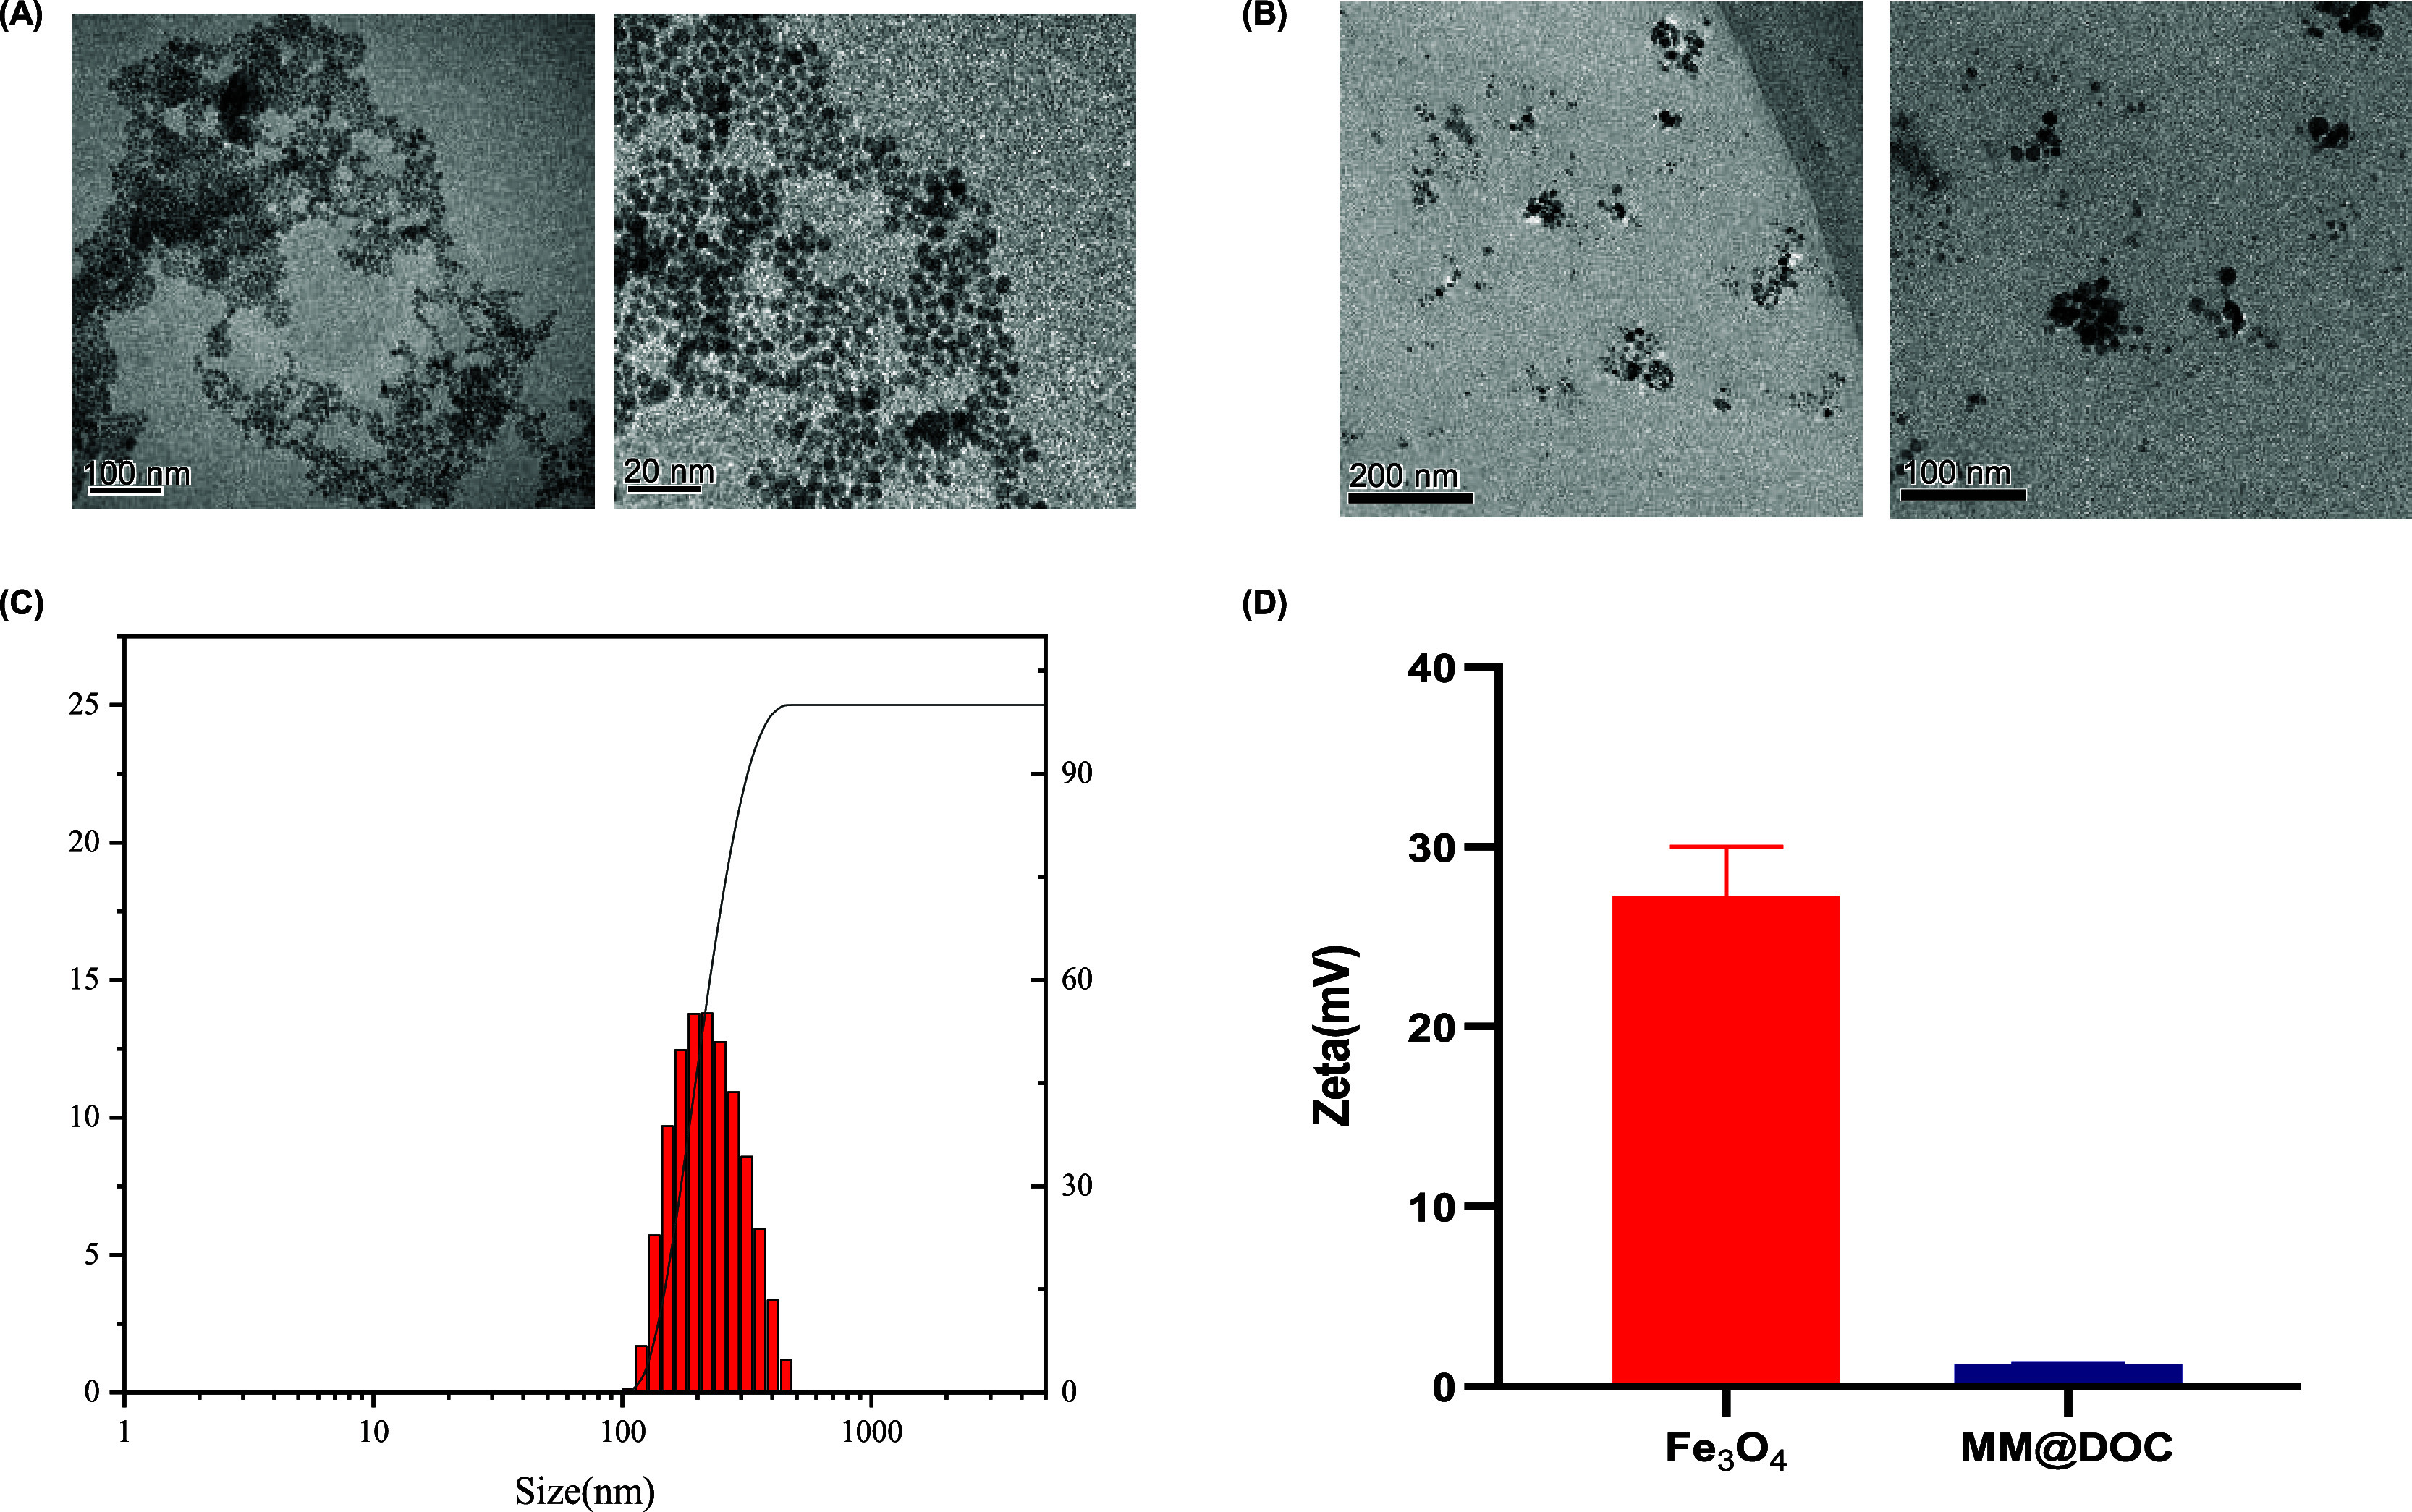
Figure 2.

Morphology, particle size, and zeta potential of MM@DOC. (A) TEM photograph of the MNPs (scale bars: 100 and 20 nm). (B) TEM photograph of MM@DOC (scale bars: 200 and 100 nm). (C) Particle size distribution and PDI of MM@DOC. (D) Zeta (ζ) potential of MM@DOC and the MNPs.
