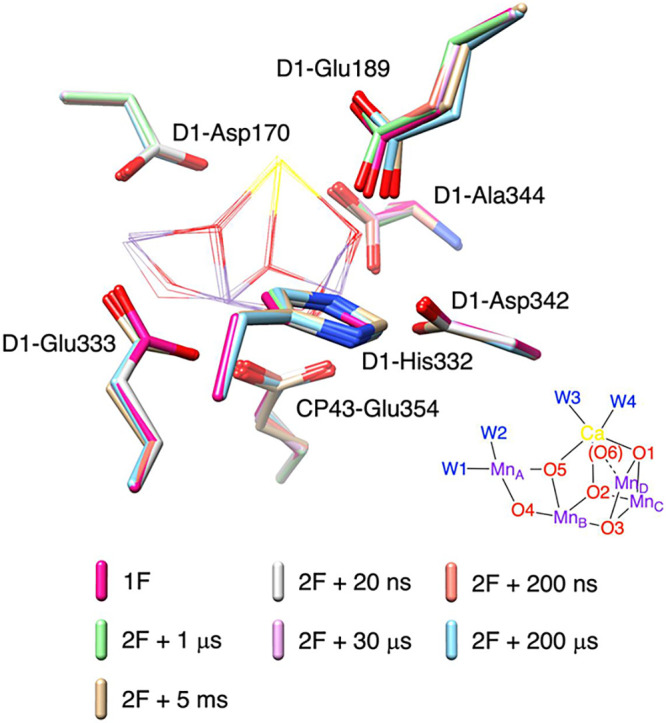
Figure 1.

Conformational changes of amino acid residues within the primary coordination sphere of the Mn cluster observed experimentally during the S2 to S3 transition.15 Structural models captured at 1F (red), and time points at 20 ns (gray), 200 ns (orange), 1 μs (light green), 30 μs (pink), 200 μs (cyan), and 5 ms (gold) after 2F are superimposed. The inorganic Mn4CaO5 cluster is displayed in wireframe, while seven amino acid residues in the primary coordination sphere are shown in stick representation.
