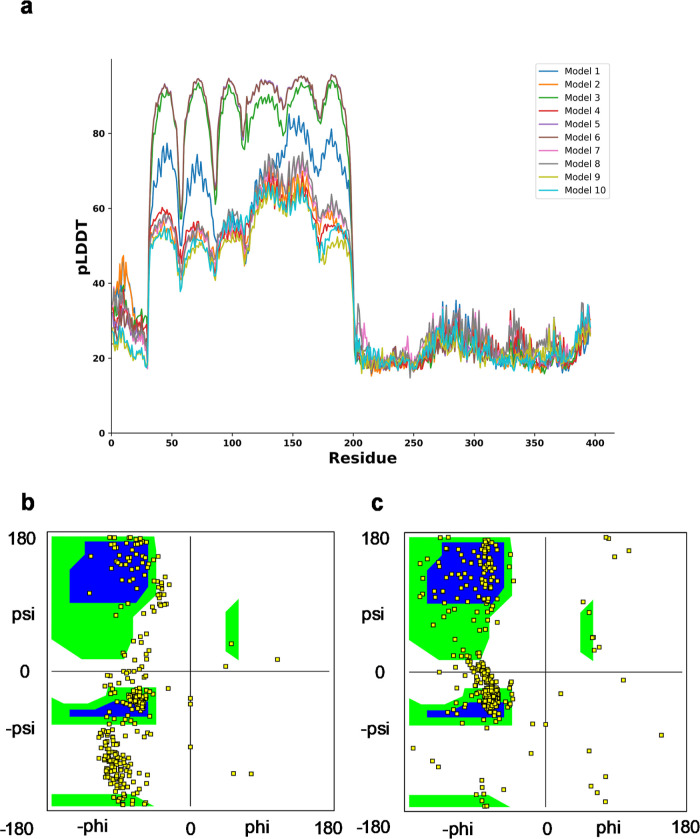
Figure 1.
(a) pLDDT score per position for the 10 predicted models generated by Alphafold2. (b) Ramachandran plot for predicted protein model 3 of Alphafold2. (c) Ramachandran plot for our predicted LMP1 protein structure. The Ramachandran plot showing two core regions (blue color) and three allowed regions in the three separate boxes (green color). The beta-sheet region occupies the left-top box, the α helix at the lower-left box, and the left-handed helix at the top-right box.

