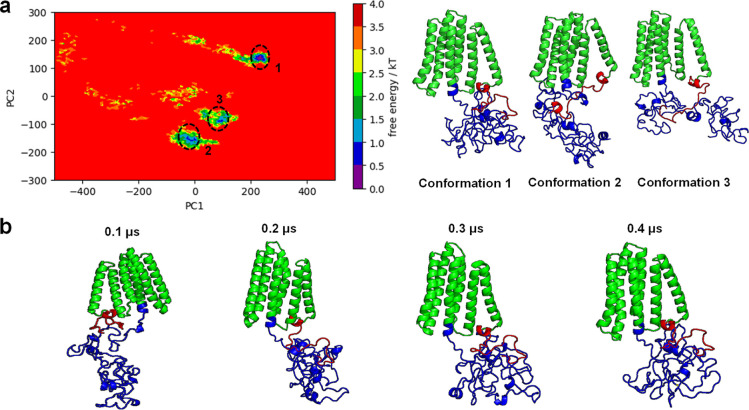
Figure 7.
Combined FEL plot with the corresponding conformations of the three basins and the time evolution of LMP1 from replicate 1 that showed the steepest basin. (a) Combined FEL plot showed 3 basins which are conformation 1 (replicate 1), conformation 2 (replicate 2), and conformation 3 (replicate 3). (b) Time evolution of LMP1 from replicate 1 that showed the steepest free-energy basin. The TMD, NTER, and CTAR domains are shown in green, red, and blue, respectively.

