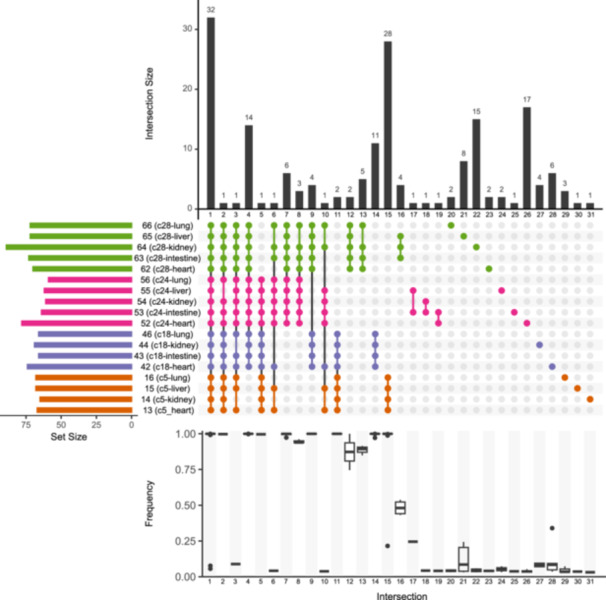
Figure 4.

UpSet visualization of SARS‐CoV‐2 mutations in different organs, relative to MN908947.3 reference genome. The grid depicts mutation sets (columns) shared between organ specimens (rows). Colors indicate which case each specimen comes from (details in Table S1). The above barplot (Intersection size) shows the number of mutations in each intersection, that is, mutations shared by several specimens (Intersections 1–19) or present in a single specimen (Intersections 20–31). Alternative allele frequencies are summarized below the grid (e.g., the box plot below Intersection 16 summarizes the frequencies of the alternative alleles of four polymorphisms exclusive of Specimens 63–65). The barplot on the left (Set size) represent the number of iSNVs retrieved from each specimen.
