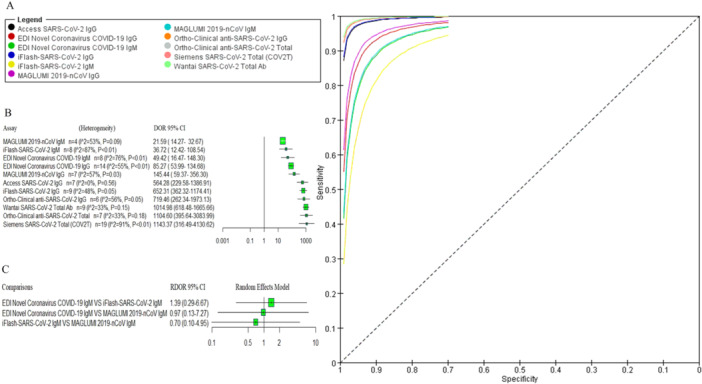
Figure 5.

(A) SROC curve of the 11 serological assays. (B) Pooled DOR with 95% CIs of the 11 serological assays. (C) Indirect comparison forest plots of RDOR with 95% CIs for three IgM assays pairwise comparisons. CIs, confidence intervals; DOR, diagnostic odds ratio; RDOR, relative diagnostic odds ratio; SROC, summary receiver operating characteristics.
