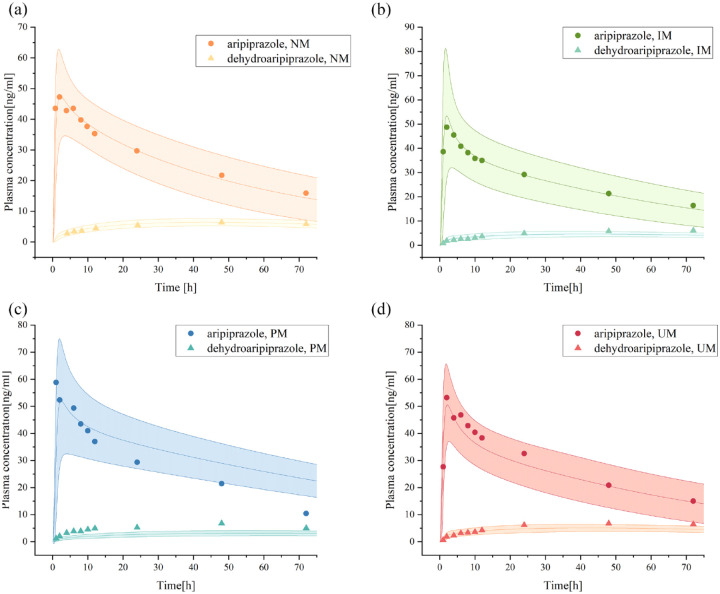
Figure 2.
Plasma concentration–time curves of aripiprazole and dehydro-aripiprazole after the administration of an oral single 10-mg dose of aripiprazole in healthy adults with CYP2D6 NM (a), IM (b), PM (c), and UM (d).
The curve above represents the predicted plasma concentration–time curves of aripiprazole and its 95% confidence interval, while the curve below represents the predicted plasma concentration–time curves of dehydro-aripiprazole and its 95% confidence interval. Simulations were compared with the corresponding observed clinical data. 22 Dots represent observed plasma concentration of aripiprazole, triangles represent dehydro-aripiprazole.
IM, intermediate metabolizer; NM, normal metabolizer; PM, poor metabolizer; UM, ultrarapid metabolizer.

