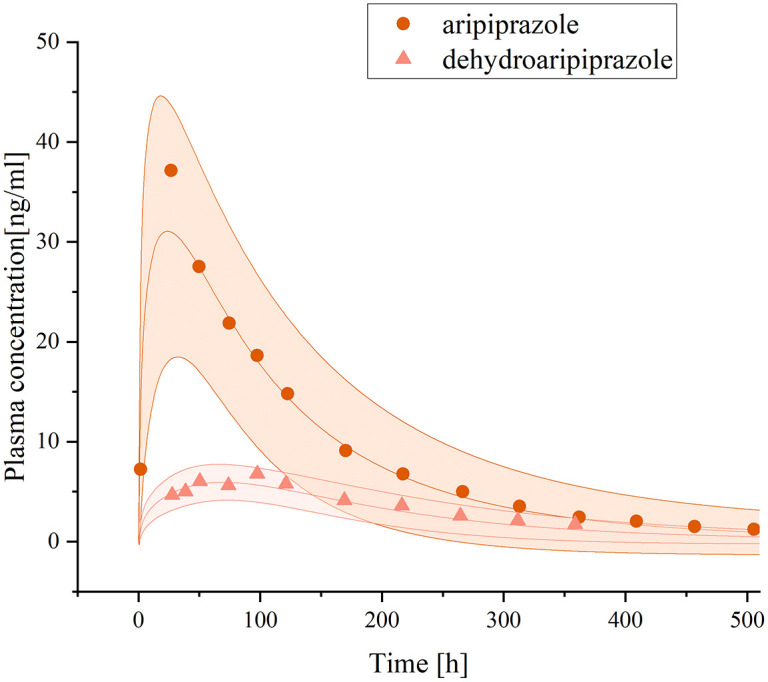
Figure 4.

Plasma concentration–time curves of aripiprazole and dehydro-aripiprazole after the administration of an oral single 15-mg dose of aripiprazole in adults with mild hepatic impairment.
The curve above represents the predicted plasma concentration–time curves of aripiprazole and its 95% confidence interval, while the curve below represents the predicted plasma concentration–time curves of dehydro-aripiprazole and its 95% confidence interval. Simulations were compared with the corresponding observed clinical data. 18 Dots represent observed plasma concentration of aripiprazole, triangles represent dehydro-aripiprazole.
