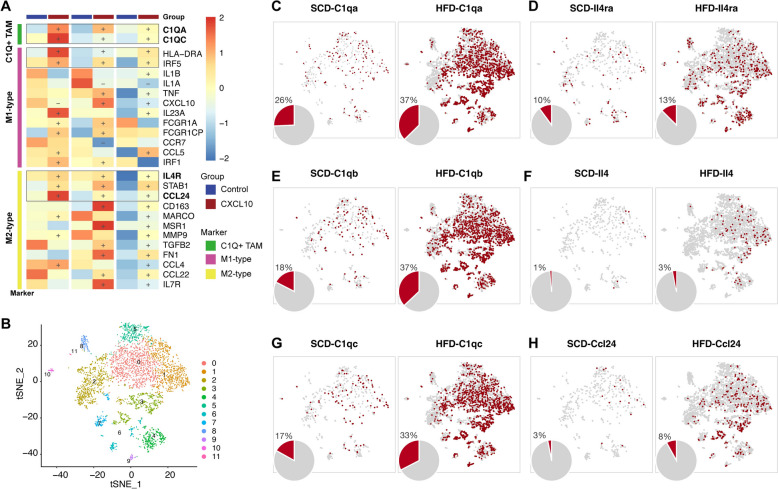
Fig. 6.
The increased expression of C1Qs in CXCL10-treated macrophages and macrophages from adipose tissue. A The addition of CXCL10 increased the expression of C1QA and C1QC in macrophages. + indicates the up-regulation in CXCL10-added macrophages with the fold change > 1.2;—indicates the down-regulation in CXCL10-added macrophages with the fold change > 1.2. B The sub-clusters in macrophages. C-H The increased expression ratios of C1qa (P value < 0.05), C1qb (P value < 0.01), C1qc (P value < 0.05), Il4ra (P value < 0.05), Il4 (P value < 0.05), and Ccl24 (P value = 0.102) in macrophages from HFD mice compared to those from SCD mice

