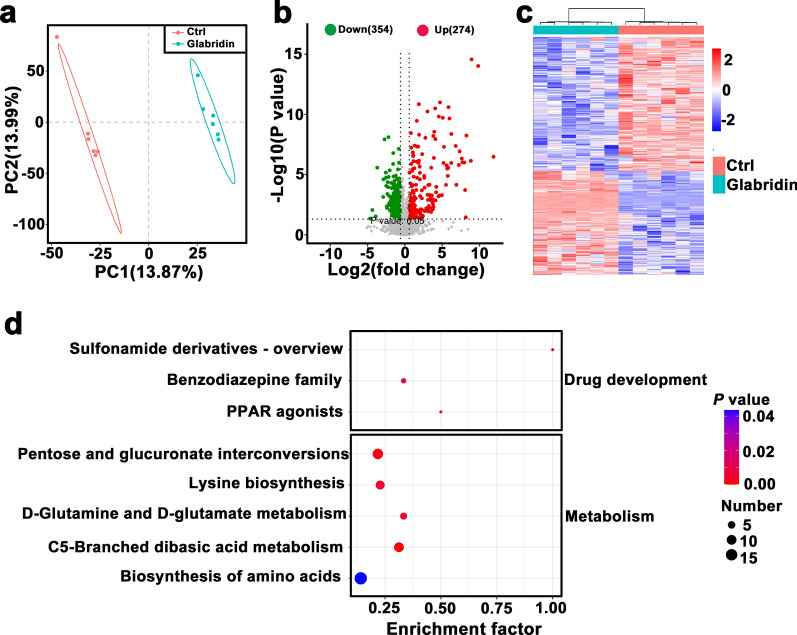
Fig. 5.
Glabridin’s effects on the metabolomic profile of Toxoplasma gondii RH tachyzoites. a Partial Least Squares Discriminant Analysis (PLS-DA) illustrating the separation between glabridin-treated and control groups. b Volcano plot of differentially accumulated metabolites (DAMs), with log2 fold change on the X-axis and −log10 (P value) on the Y-axis. The vertical dotted lines indicate a two-fold change threshold; grey dots represent non-significant metabolites, while red and green dots indicate up- and downregulated DAMs, respectively. c Heatmap of DAM clusters, showing metabolic differences between glabridin-treated and untreated T. gondii. Red and blue indicate up- and downregulated metabolites, respectively. The impact factor represents the ratio of DAMs to the total metabolites within each pathway. d KEGG pathway analysis of differential metabolites, where dot color reflects log10 (P value) and dot size corresponds to the number of DAMs enriched in each KEGG pathway

