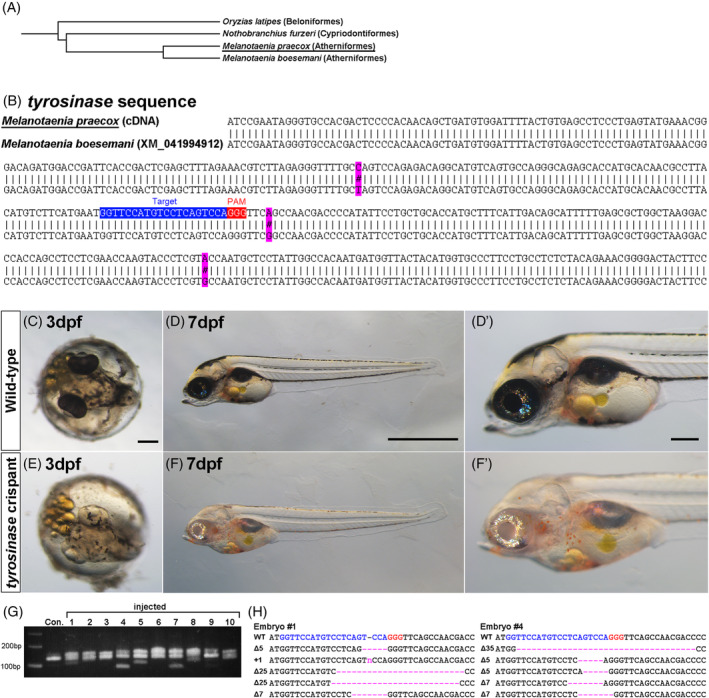
FIGURE 3.

(A) A phylogenetic tree of M. praecox and related species. 1 , 41 (B) The alignment indicates differences in tyrosinase mRNA sequence between M. praecox and M. boesemani. The binding sequence of guide RNA (gRNA) or protospacer‐adjacent motif (PAM) is shown by a blue or red rectangle. (C)–(F’) Embryos injected with the Cas9 protein and gRNA lack black pigmentation (bottom) at 3 days post‐fertilization (dpf) (C), (E) and 7 dpf (D), (D’), (F), (F’) when the wild type shows black pigmentation (top). (G) Heteroduplex mobility assay (HMA). Multiple bands were shown in embryos injected with the Cas9 protein and the gRNA, whereas a single band was shown in the control (Con.) without injection. (H) Mutation spectrum revealed by Sanger sequencing. Magenta dashes and the letter “n” indicate identified deletions and an insertion, respectively. The gRNA target sequence and its PAM are indicated by blue and red letters, respectively. The sizes of deletions and insertions are shown to the left of each sequence (Δ, deletions; +, insertions). The numbers of the embryos (#1 and #4) in (H) correspond to the lane numbers in (G). Scale bars indicate 200 μm (C), (E), (D’), (F’) or 1 mm (D), (F).
