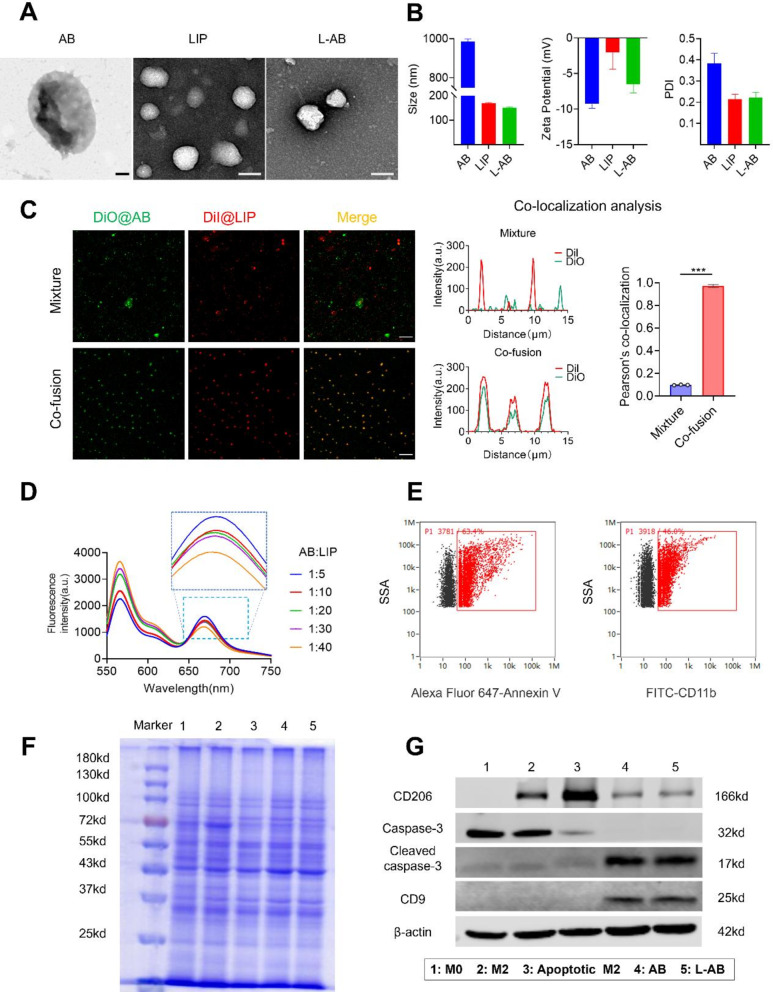
Fig. 1.
Preparation and characterization of L-AB. (A) TEM images of AB, LIP and L-AB. Scale bar = 200 nm. (B) Hydrodynamic size distribution and ζ potential of AB, LIP, and L-AB (n = 3). (C) CLSM images and co-localization analysis of a physical mixture (LIP with AB) (mixture) and L-AB (co-fusion) (red, LIP-DiI; green, AB-DiO; Scale bar = 10 μm). (D) FRET results of L-AB with different fusion ratios of LIP and AB. (E) The expression of PS and CD11b on the L-AB surface which was detected by nanoflow cytometry. (F) SDS-PAGE images of marker, 1: M0; 2: M2; 3: apoptotic M2; 4: AB; 5: L-AB.(G) Western blot of specific makers of the M0/M2/apoptotic M2 cell, AB and L-AB, 1: M0; 2: M2; 3: apoptotic M2; 4: AB; 5: L-AB

