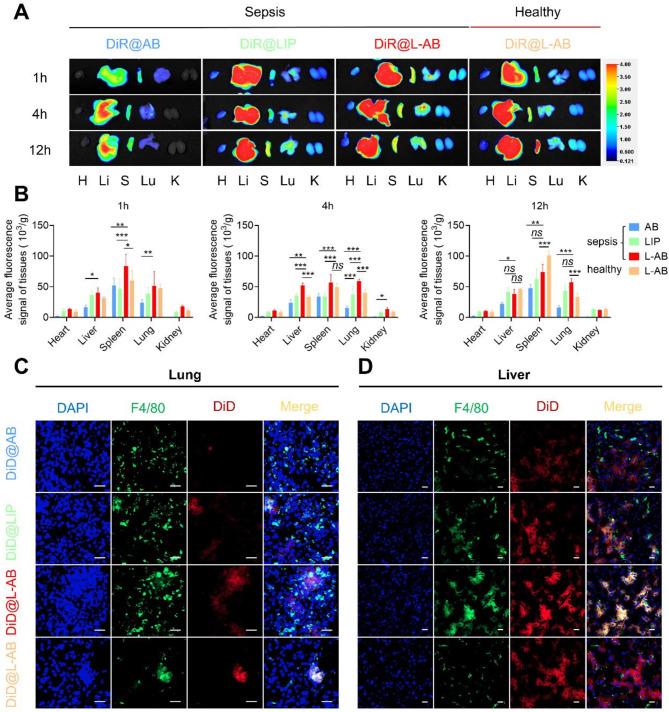
Fig. 4.
Ex vivo biodistribution of L-AB. (A) Ex vivo biodistribution of DiR@AB, DiR@LIP, and DiR@L-AB in main organs at different time intervals via IVIS imaging. (B) Quantitative analysis of the DiR fluorescence signal in septic mice or healthy mice after intravenous injection of DiR@AB, DiR@LIP, and DiR@L-AB (n = 3). H, Li, S, Lu, and K represent heart, liver, spleen, lung, and kidney, respectively. (C, D) The localization of DiD@AB, DiD@LIP, and DiD@L-AB within the lung and liver, immunofluorescence analysis of lung and liver sections stained with F4/80. The sections were visualized using blue (DAPI), green (F4/80), and red (DiD) fluorescence, scale bar = 20 μm. Data are displayed as mean ± SD. *P < 0.05, **P < 0.01, ***P < 0.001

