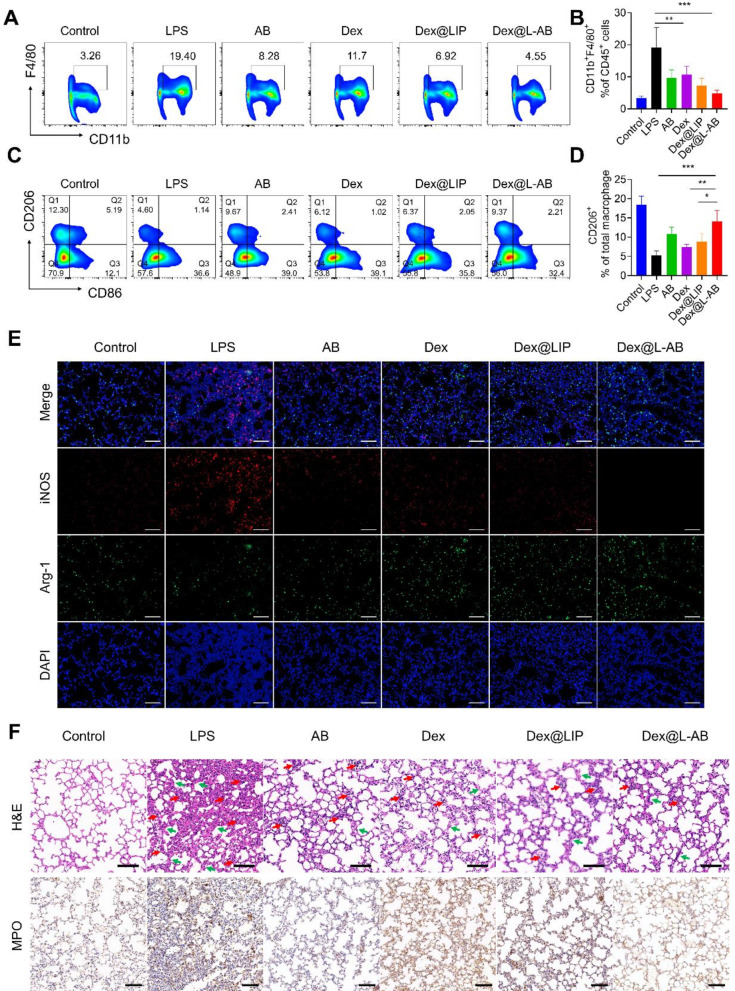
Fig. 6.
Therapeutic effect for experiencing sepsis-induced acute lung injury. (A) Representative plots of CD11b+ F4/80+ cells as a percentage of the total CD45+ cells population and (B) corresponding quantification results after various treatments (n = 5). (C) Representative plots of CD206+ cells as a percentage of the total macrophages population and (D) corresponding quantification results after various treatments (n = 5). (E) Representative fluorescence images of iNOS and Arg-1 in lung tissue after different treatments. (F) H&E staining and IHC staining of MPO of lung after different treatments (red arrows indicate inflammatory cells infiltration, green arrows indicate thickened alveolar walls). Scale bar = 100 μm. Data are displayed as mean ± SD. *P < 0.05, **P < 0.01, ***P < 0.001

