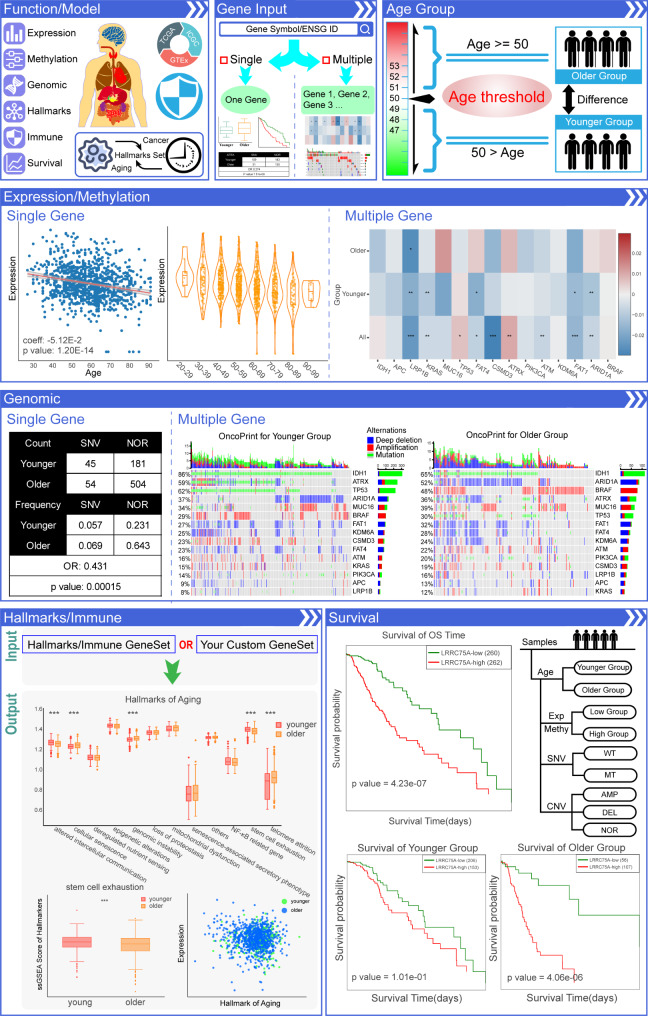
Fig. 2.
Content and user interface of Aging2Cancer. (i) Search by a gene or gene list in a specific cancer type with an interested age threshold. (ii) Expression/Methylation module. The results page of this module includes a scatter plot that indicates the relationship between aging and gene expression/methylation and a violin plot exhibits the distribution of gene expression/methylation level in different aging groups. The heatmap plots shows the difference in the linear regression coefficients of multiple genes between the younger and older groups. (iii) Genomic module. The results page of this module included tables of the count and frequency of CNV/SNV in different aging groups. The differences in genomic alterations in different groups are estimated by the chi-square test. Waterfall plots shows the differences in the genomic patterns of multiple genes between the younger and older groups. (iv) Hallmarks/Immune module. The results page of this module included box plots that exhibit the scores of cancer- and aging-related hallmarks, immune-related scores, and user’s custom gene set scores in different aging groups, and scatter plots that indicate the relationship between hallmarks/immune scores and gene expression in different aging groups. (v) Survival module. The results page of this module included survival curves that consider both gene expression and aging information

