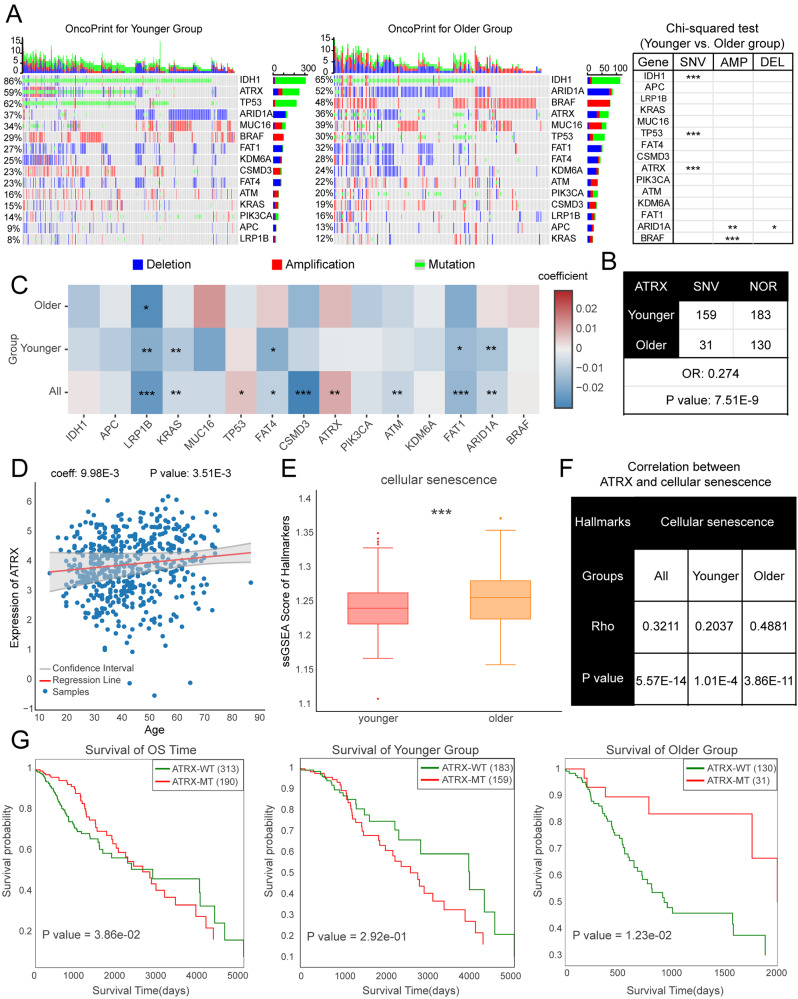
Fig. 3.
Case study of Aging2Cancer. (A) Genomic alterations of 15 essential genes in LGG younger and older patients. Left panel showed the genomic alteration distributions via oncoprint plot. Right panel showed the difference of genomic alterations between LGG groups via Chi-squared test. (B) The distribution of mutation counts for ATRX gene for LGG younger and older patients. (C) The difference in linear combinations of 10 essential genes expressions between younger and older LGG patients. (D) The relationship between aging and ATRX expression in LGG patients. (E) Violin plot showed the difference of cellular senescence scores between LGG younger and older groups. (F) The correlation coefficients between ATRX and cellular senescence between LGG younger and older groups. (G) Kaplan–Meier curves for overall survival in LGG younger and older patients according to the ATRX mutation status

