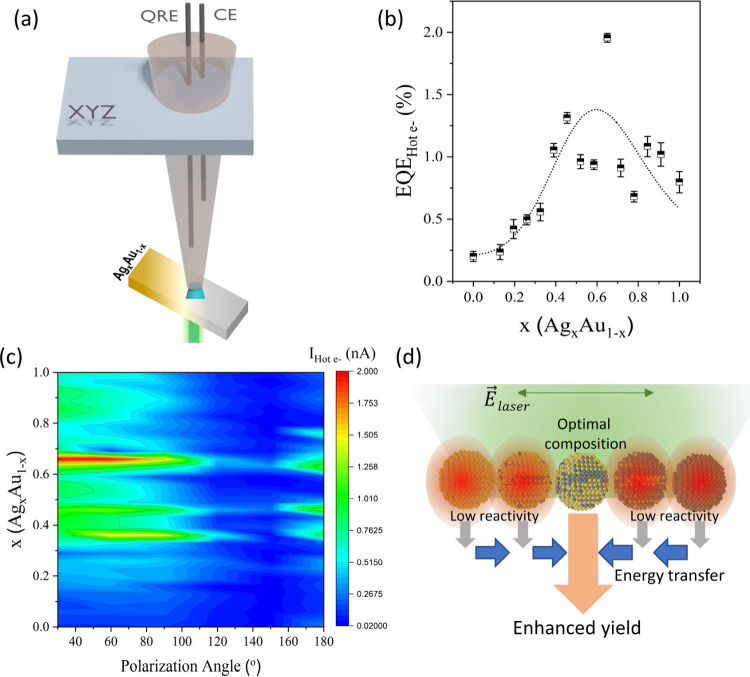
Figure 5.
Photoelectrochemical HE characterization. (a) Schematic representation of the localized photoelectrochemical analysis system consisting of an electrolyte-filled (0.1 M Na2SO4) capillary with quasi-reference and counter electrode that touches the FTO/TiO2/AgxAu(1–x) sample, which is back-illuminated with a 532 nm laser. (b) Extracted external quantum efficiency (EQE) of hot electron injection into the electrolyte vs alloy composition. (c) Polarization-dependent photocurrent mapping that demonstrates a pronounced polarization effect at optimized compositions. (d) Schematic representation of the mechanism responsible for the observed polarization response: Plasmonic energy transfer from less reactive particle compositions to highly reactive compositions leads to enhanced yield if the light E-field is parallel to the gradient direction.

