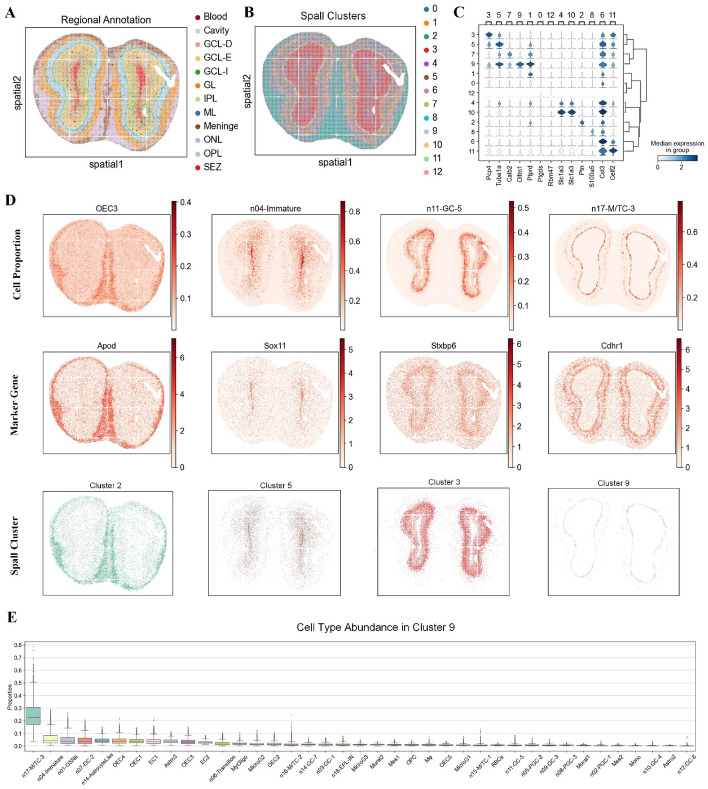
Fig. 6.
Analysis of the large-scale MOB dataset generated from Stereo-seq using Spall. A Regional annotation of the MOB dataset. B Spatial domains identified based on cell type proportions estimated by Spall. C. Stacked violin plot showing differential gene expression across the spatial domains identified by Spall. D Top: Spatial proportions of four layer-specific cell types predicted by Spall. Middle: Spatial expression of corresponding cell-type-specific marker genes. Bottom: The four corresponding spatial domains identified from decomposition results inferred by Spall. E Cell type abundance analysis in domain 9. The center line represents the median, box limits show the upper and lower quartiles, and whiskers indicate 1.5 × the interquartile range

