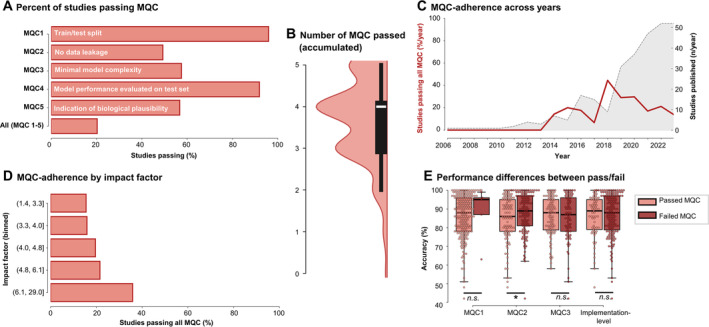
FIG. 4.

Minimal quality criteria (MQC) analysis. (A) Percentage of studies passing individual or all MQC. (B) Violin plot of the accumulated number of MQC passed by each individual study. (C) Number of total studies published (gray shaded area) and percentage of studies passing all MQC (red line) over the years. (D) Percentage of studies passing all MQC by impact factor. (E) Differences in accuracy between studies passing or failing individual or all implementation‐level MQC. [Color figure can be viewed at wileyonlinelibrary.com]
