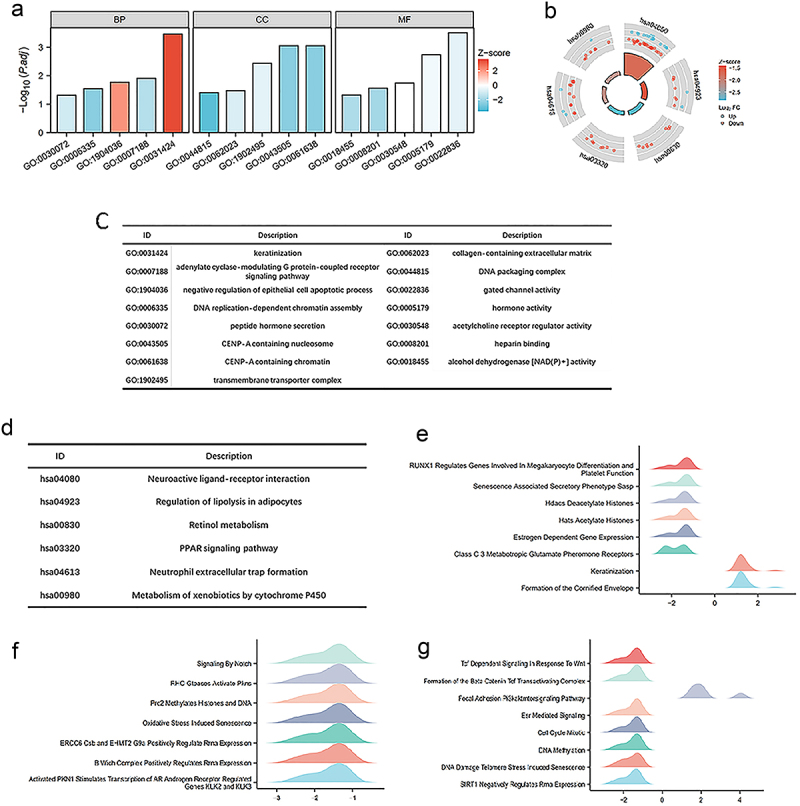
Figure 4.

Functional enrichment analysis about HGH1 gene. (a, b) GO and KEGG results. (c, d) Category names for GO and KEGG analyses corresponding to their respective identifiers. (e–g) GSEA analysis results. A positive value on the abscissa indicates positive correlation between HGH1 and the pathway, while a negative value indicates an inverse correlation.
