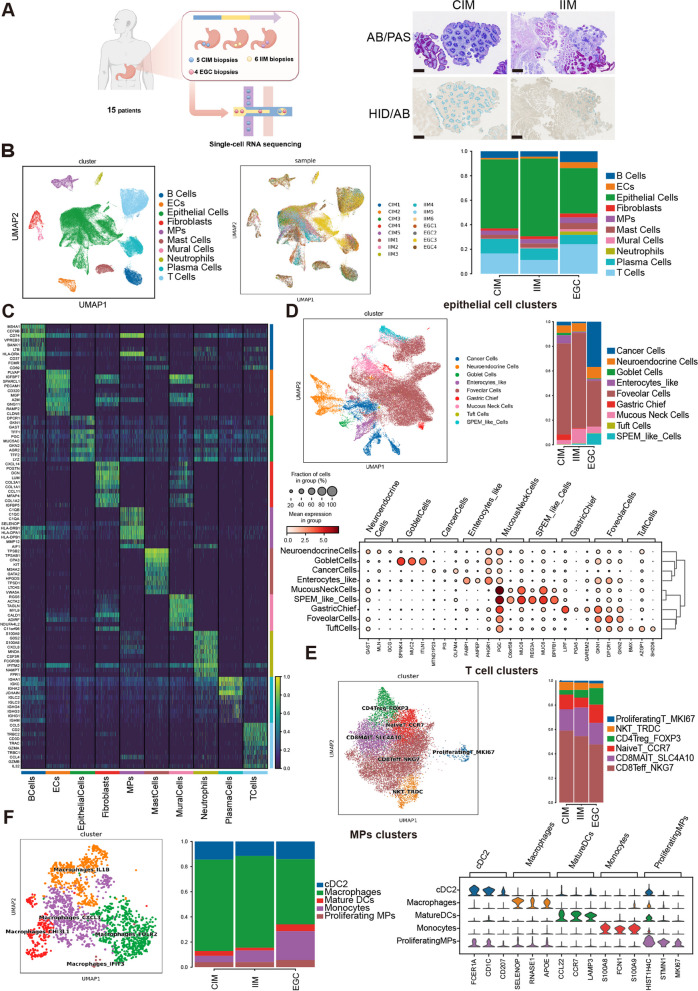
Fig. 1.
scRNA-seq reveals various cell types involved in intestinal-type GC carcinogenesis. A Workflow of sample processing and scRNA-seq (left). AB/PAS and HID/AB staining images of CIM and IIM. Scale bar, 250 μm (right). B UMAP plot of single cells annotated by major cell types (left) and samples (middle). The percentages of different cell types in CIM, IIM and EGC samples are shown (right). C Heatmap of the DEGs (rows) corresponding to major cell types (columns). D UMAP of epithelial cells colored according to inferred cell type (left). Fractions of epithelial cell clusters detected in each group (right). Dot plot of different marker genes of epithelial cell clusters (bottom). E UMAP of T cells colored according to inferred cell type (left). Fractions of T-cell clusters detected in each group (right). F UMAP of MP clusters colored according to inferred cell type (left). Fractions of MP clusters detected in each group (middle). Violin plots of different marker genes of MP clusters (right)

