Fig. 2.
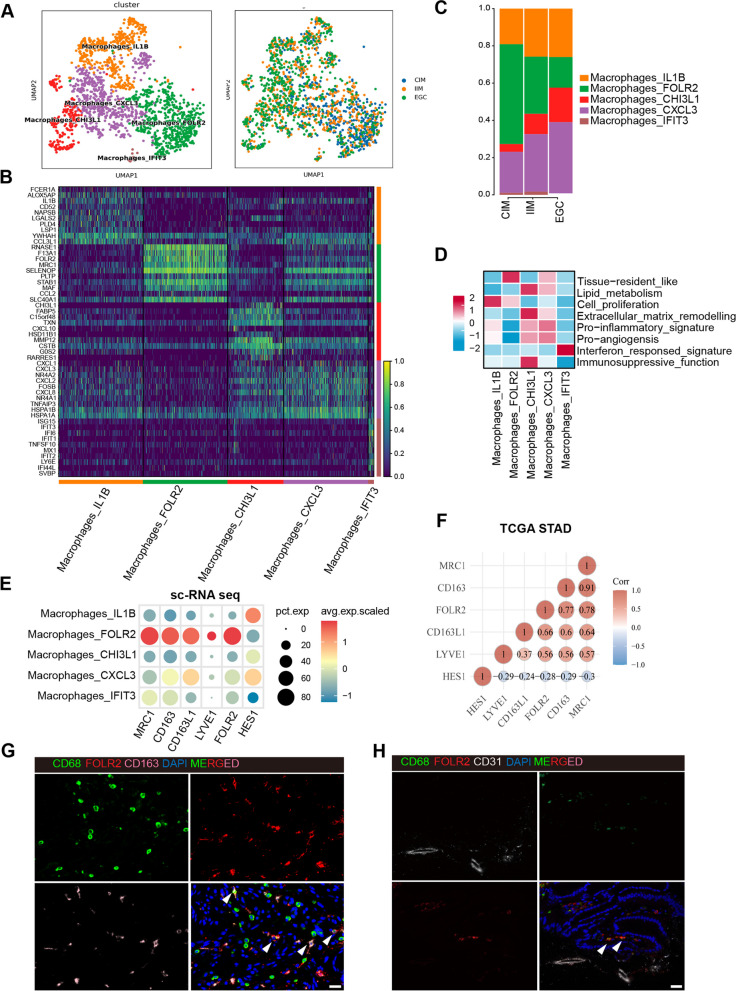
scRNA-seq reveals five subsets of macrophages. A UMAP of macrophage clusters colored according to inferred cell type (left) and group (right). B Heatmap of the DEGs corresponding to macrophage clusters. C Fractions of macrophage clusters detected in CIM, IIM and EGC samples. D Heatmap of the macrophage-related gene signature scores in macrophage subsets. E Bubble plot of macrophage tissue-resident genes among macrophage clusters. F Spearman’s rank correlation between FOLR2 gene expression and macrophage tissue-resident gene expression in the TCGA-STAD cohort. G Representative mIHC images of CD68, FOLR2 and CD163 in CIM tissues. Scale bar, 25 μm. H Representative mIHC images of FOLR2 and CD31 in CIM tissues. Scale bar, 25 μm

