Fig. 3.
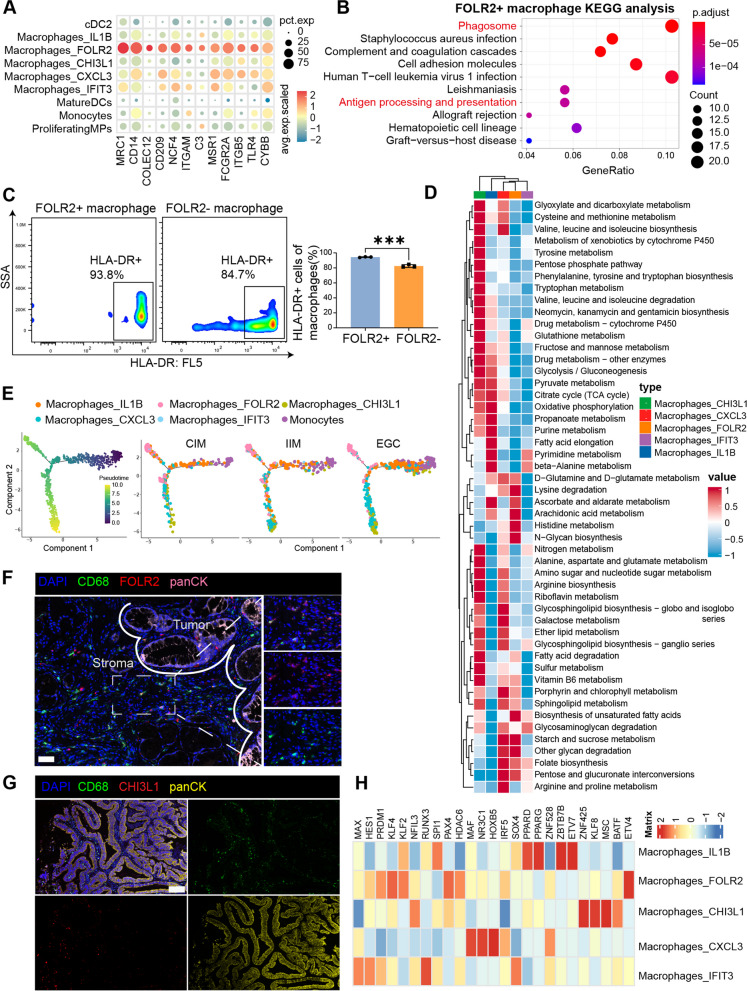
FOLR2+ macrophages play crucial roles in antitumor immunity. A Bubble plot of phagocytosis-related genes in MP clusters. B KEGG analysis of DEGs inFOLR2+macrophages.C Representative flow cytometry plots of HLA-DR expression in FOLR2+ or FOLR2- MDMs from the same healthy donor (n=3). D Landscape of the metabolic pathways in different macrophage clusters. The color represents the metabolic value.E Pseudotime ordering of MP cells into a major trajectory with two bifurcations. The color gradient denotes the pseudotime score (left). Pseudotime trajectory of MP cells presented according to cell clusters for each group (right).F Representative mIHC images of FOLR2, CD68 and cytokeratin (CK) in EGC samples. Scale bar, 50 μm.G Representative mIHC images of CHI3L1, CD68 and CK in EGC samples. Scale bar, 50 μm. H Heatmap of the differentially predicted transcriptional regulons in the five macrophage clusters

