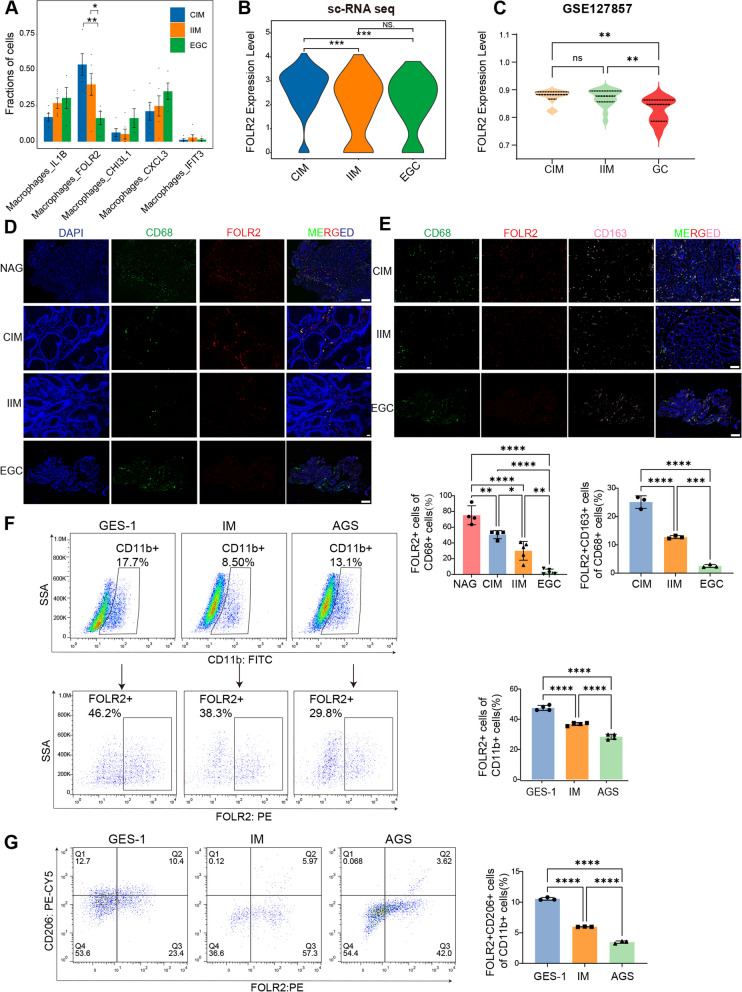
Fig. 4.
The number of FOLR2+ macrophages gradually decrease during EGC tumorigenesis. A The proportions of each macrophage cluster in the CIM, IIM and EGC groups from our scRNA-seq data. B Violin plots of log-normalized FOLR2 mRNA expression in FOLR2+ macrophages from our scRNA-seq data. C Violin plots of log-normalized FOLR2 mRNA expression in CIM, IIM and EGC tissues from the GSE127857 database. D Representative mIHC images of CD68 and FOLR2 in NAG (n=4), CIM (n =4), IIM (n=6) and EGC (n=5) tissues. Scale bar, 50 μm. E Representative mIHC images of CD68, FOLR2 and CD163 in CIM, IIM and EGC tissues (n=3). Scale bar, 50 μm. FRepresentative flow cytometry plots of FOLR2 expression in CD11b+MDMs from MDMs cocultured with GES-1, IM and AGS cells (n=4). G Representative flow cytometry plots of CD206 and FOLR2 expression in CD11b+MDMs from MDMs cocultured with GES-1, IM and AGS cells (n=3). The data were analyzed by the Wilcoxon rank-sum test orthe Kruskal‒Wallis test.*p < 0.05; **p < 0.01; ***p < 10−3; ****p < 10−4; NS: not significant

