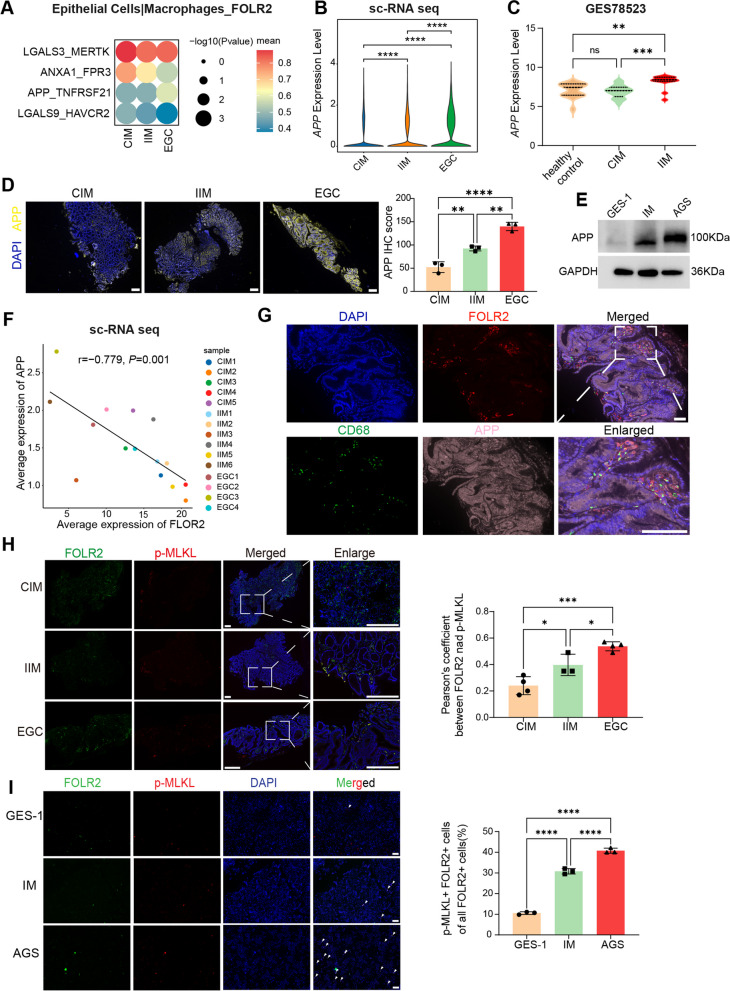
Fig. 7.
APP upregulation in epithelial cells promotes necroptosis of FOLR2+ macrophages by enhancing the APP‒TNFRSF21 axis. A Bubble heatmap of ligand‒receptor interactions between epithelial cells and FOLR2+macrophages via CellPhoneDB. The Y-axis represents ligand‒receptor pairs. The X-axis denotes groups. The color of the circle denotes the mean expression level. B Violin plots of log-normalized APP mRNA expression in epithelial cells from our scRNA-seq data. C Violin plots of log-normalized APP mRNA expression in healthy control, CIM and IIM tissues from the GSE78523. D Representative mIHC images of APP expression in CIM, IIM and EGC tissues (n=3). Scale bar, 200 μm. E Western blot analysis of APP protein levels in GES-1, IM and AGS cells. F Spearman correlation between FOLR2 expression in FOLR2+ macrophages and APP expression in epithelial cells from our scRNA-seq data. G Representative mIHC images of FOLR2, CD68 and APP in EGC tissues. Scale bar, 50 μm. H Representative mIHC images of FOLR2 and p-MLKL expression in CIM (n=4), IIM (n=3) and EGC (n=4) tissues. Scale bar, 200 μm. The quantification of necroptotic FOLR2+ macrophages (FOLR2+p-MLKL+) from CIM, IIM, and EGC tissues is shown (n=3). I Representative mIHC images of FOLR2 and p-MLKL expression in macrophages cocultured with GES-1, IM and AGS cells. Scale bar, 200 μm. The quantification of necroptotic FOLR2+macrophages is shown. The data were analyzed by Spearman correlation analysis,theWilcoxon rank-sum test or the Kruskal‒Wallis test. *p < 0.05; **p < 0.01; ***p < 10−3; ****p < 10−4

