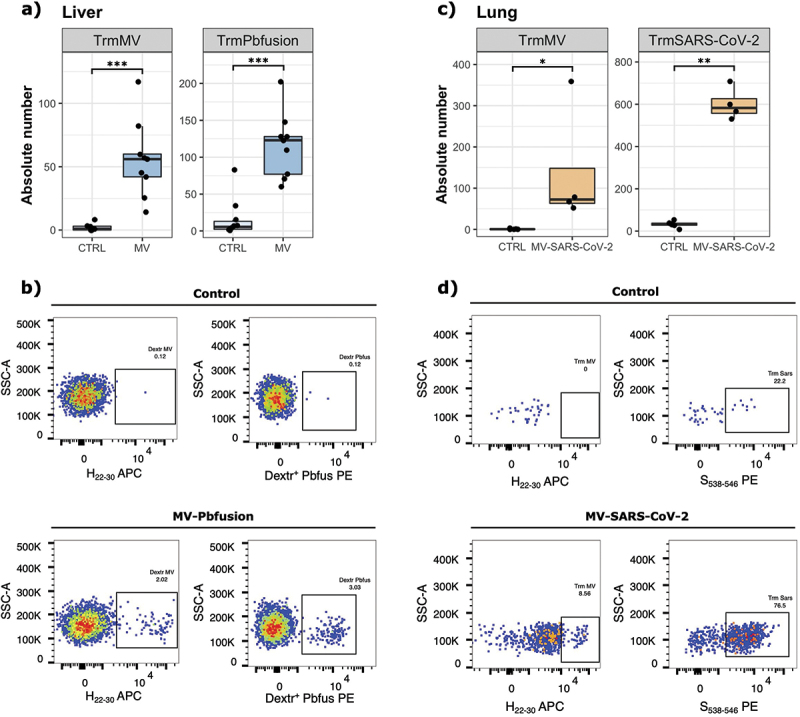
Figure 6.

Generation of antigen specific Trm after immunization with MV viruses expressing vectorized antigens. (a) Absolute number of MV-specific and Pbfusion-specific CD8+ Trm cells in the liver of mice (n = 4–6 per group, two experiments) immunized IP with 105 TCID50 of MV Pbfusion or mock-injected (opti-MEM medium), twenty-one days post immunization. (b) Representative flow cytometry plots demonstrating the detection of liver MV-specific and Pbfusion-specific dextramer (gated on CD8+ CD69+ KLRG1− CD62L− CD11a+ CXCR6+ CXCR3+) on control or MV Pbfusion immunized mice. (c) Absolute number of MV-specific and SARS-CoV-2-specific CD8+ Trm cells in the lungs of mice (n = 4–6 per group) immunized in with 105 TCID50 of MV_SARS-CoV-2 or mock-injected (opti-MEM medium), twenty-one days post immunization. (d) Representative flow cytometry plots demonstrating the detection of lung MV-specific or SARS-CoV-2 specific dextramer (gated on CD8+ CD44+ CD62L− CD69+ CXCR3+ CD49+) on control or MV SARS-CoV-2 immunized mice. Each data point represents an individual mouse. Data are represented as median with IQR. Significant differences between the groups were determined by the two-tailed Mann–Whitney test (*p < .05, **p < .01, ***p < .001).
