Fig. 3.
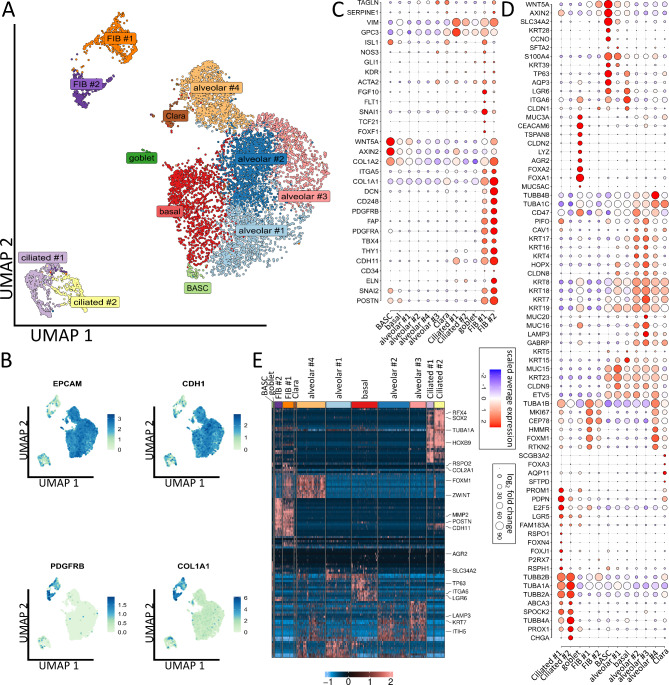
Single cell analysis revealed the composition of lung organoids. (A) Uniform Manifold Approximation and Projection for Dimension Reduction (UMAP) of all single cells colored by identified clusters. N = 3 biological replicates. Cell-type labels for each cluster are based on expression of canonical cell-type markers displayed in the dot plot in C, D or Fig. S4B (B) Expression map of representative epithelial (EPCAM, CDH1) and mesenchymal (PDGFRB, COL1A1) marker genes in all clusters. (C) Dot plot of indicated mesenchymal marker genes. Size of the dots indicate the percentage of cells in which this gene was found, the color indicates the normalized value of the expression. (D) Dot plot of epithelial marker genes. (E) Row-normalized heatmap of top ten differentially expressed genes per cluster. Important genes are indicated by name. See also Fig. S4

