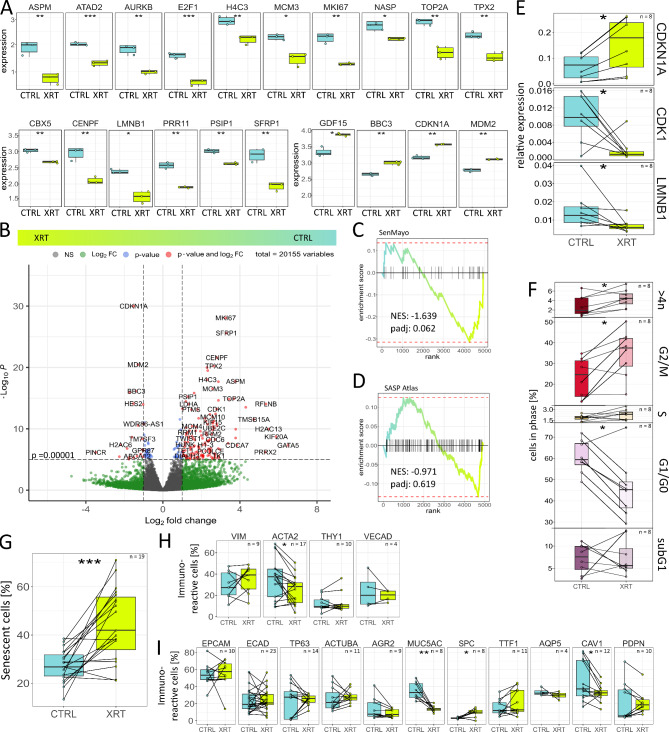
Fig. 4.
Modeling lung injury: senescence as prominent radiation response within LuOrgs. (A) Expression pattern changes in lung organoids after irradiation (bulk RNAseq). Normalized expression of control (CTRL) and irradiated (XRT) lung organoids at d52 (96 h post RT with 10 Gy) of the 20 most affected genes following RT are depicted (n = 3 biological replicates per group). (B) Volcano plot of all genes. Labels are added to genes which have an absolute log2 fold-change higher than 1.5 and a p-value lower than 0.00001 (Wald test). (C) Enrichment plots of a geneset enrichment analysis of the SenMayo gene set identifying senescent cells across tissues [18]. P-values are calculated by adaptive multi-level split Monte-Carlo scheme (fgsea R-package). (D) Enrichment plots of a gene set enrichment analysis of the SASP Atlas gene set comprising soluble proteins and exosomal cargo SASP factors exclusive to ionizing radiation [19]. P-values are calculated by adaptive multi-level split Monte-Carlo scheme (fgsea R-package). (E) Indicated transcript levels were quantified using Real-Time RT-PCR and are shown as relative expression to beta-actin. (F) Cell cycle phases and apoptotic cells (subG1) were analyzed by flow cytometry in LuOrgs following single cell dissociation. See methods for details. (G) RT-induced senescence formation was analyzed by C12FDG staining prior to flow cytometry analyses. Flow cytometry quantification of mesodermal (H) and epithelial (I) lung cell types of single cell dissociated LuOrgs. Biological replicates as indicated. Mann-Whitney 𝑈 test. * = 0.05, ** = 0.01, *** = 0.001. See also Figure S5 and S6

