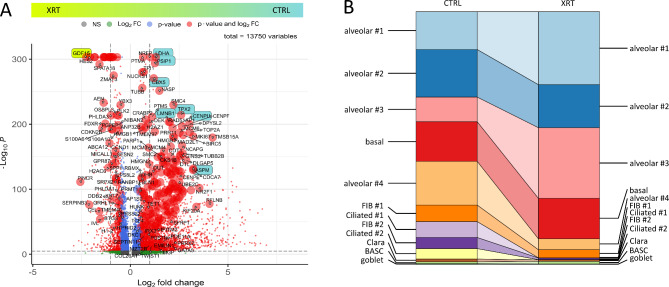
Fig. 5.
Single cell analysis reveal a differential RT response in LuOrgs with the airway epithelium being most sensitive. (A) Volcano plot of all differentially expressed genes (cluster-independent) obtained from scRNAseq data sets (n = 3 biological replicates, Mann-Whitney 𝑈 test). Labels are added to genes which have an absolute log2 fold-change higher than 1.5 and a p-value lower than 0.00001. Top differentially expressed genes from the bulk RNAseq depicted in Fig. 2A are additionally colored in green or blue and all identified genes depicted in Fig. 4B are highlighted by increased dot size. (B) Changes of cluster sizes due to irradiation

