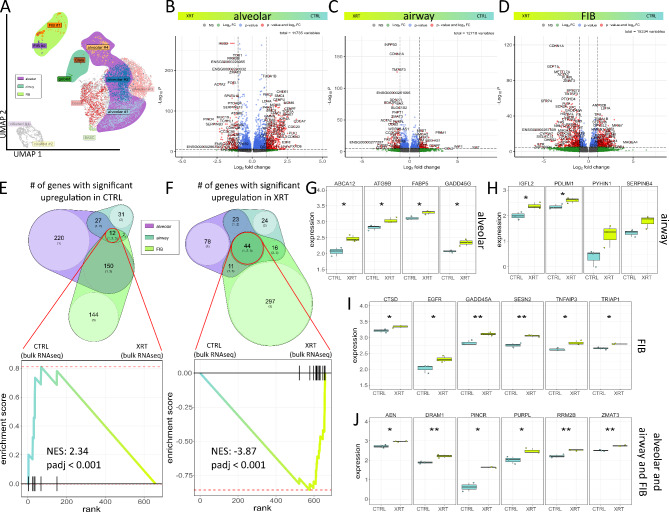
Fig. 7.
Potential RT-induced senescence signatures in lung organoid meta clusters. (A) Uniform Manifold Approximation and Projection for Dimension Reduction (UMAP) of all XRT single cells colored by identified clusters. N = 3 biological replicates. Meta cluster are shown by respective color. Volcano plot of all genes in (B) alveolar (comprising the alveolar clusters #1, #2, and #4) (C) airway (Clara and goblet) and (D) FIB (#1 and #2) meta cluster. Labels are added to genes which have an absolute log2 fold-change higher than 1.5 and a p-value lower than 0.00001 (Mann-Whitney 𝑈 test). Venn diagrams of significantly up regulated genes in CTRL (E) and RT-treated (F) LuOrgs meta clusters and enrichment plot of the bulk RNAseq data sets before and after RT. P-values are calculated by adaptive multi-level split Monte-Carlo scheme (fgsea R-package). Normalized expression of 3 biological replicates of control (CTRL) and irradiated (XRT) LuOrgs at d52 in respective bulk RNAseq for genes differentially expressed in single cell alveolar (F), airway (G) and FIB (H) meta clusters, and intersection of all three (I). Mann-Whitney 𝑈 test. * = 0.05, ** = 0.01, *** = 0.001. See also Figure S8, S9 and Table S1

