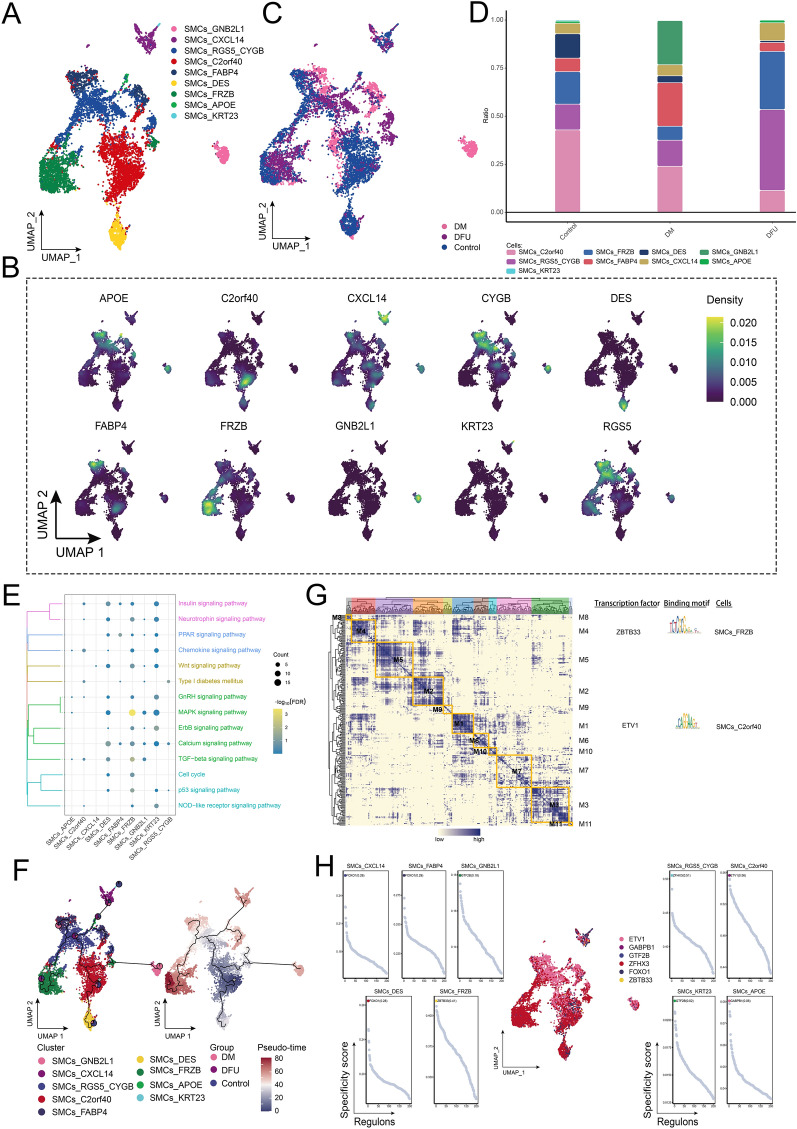
Fig. 4.
Ecological landscape of SMCs. A Single-cell atlas showing that SMCs comprise nine major cell subpopulations. B Single-cell atlas showing genes specifically expressed in each subpopulation of SMCs. C Single-cell atlas shows clusters of SMCs in control, DM and DFU groups. D Difference in abundance of each subpopulation of SMCs in the control, DM and DFU groups. E Signaling pathways involved in SMCs subpopulations. F Developmental trajectory of SMCs. The pie chart shows the proportion of different populations in the SMCs subpopulations. G Gene regulatory network of the SMCs subpopulations. H Transcription factors regulating SMCs subpopulations

