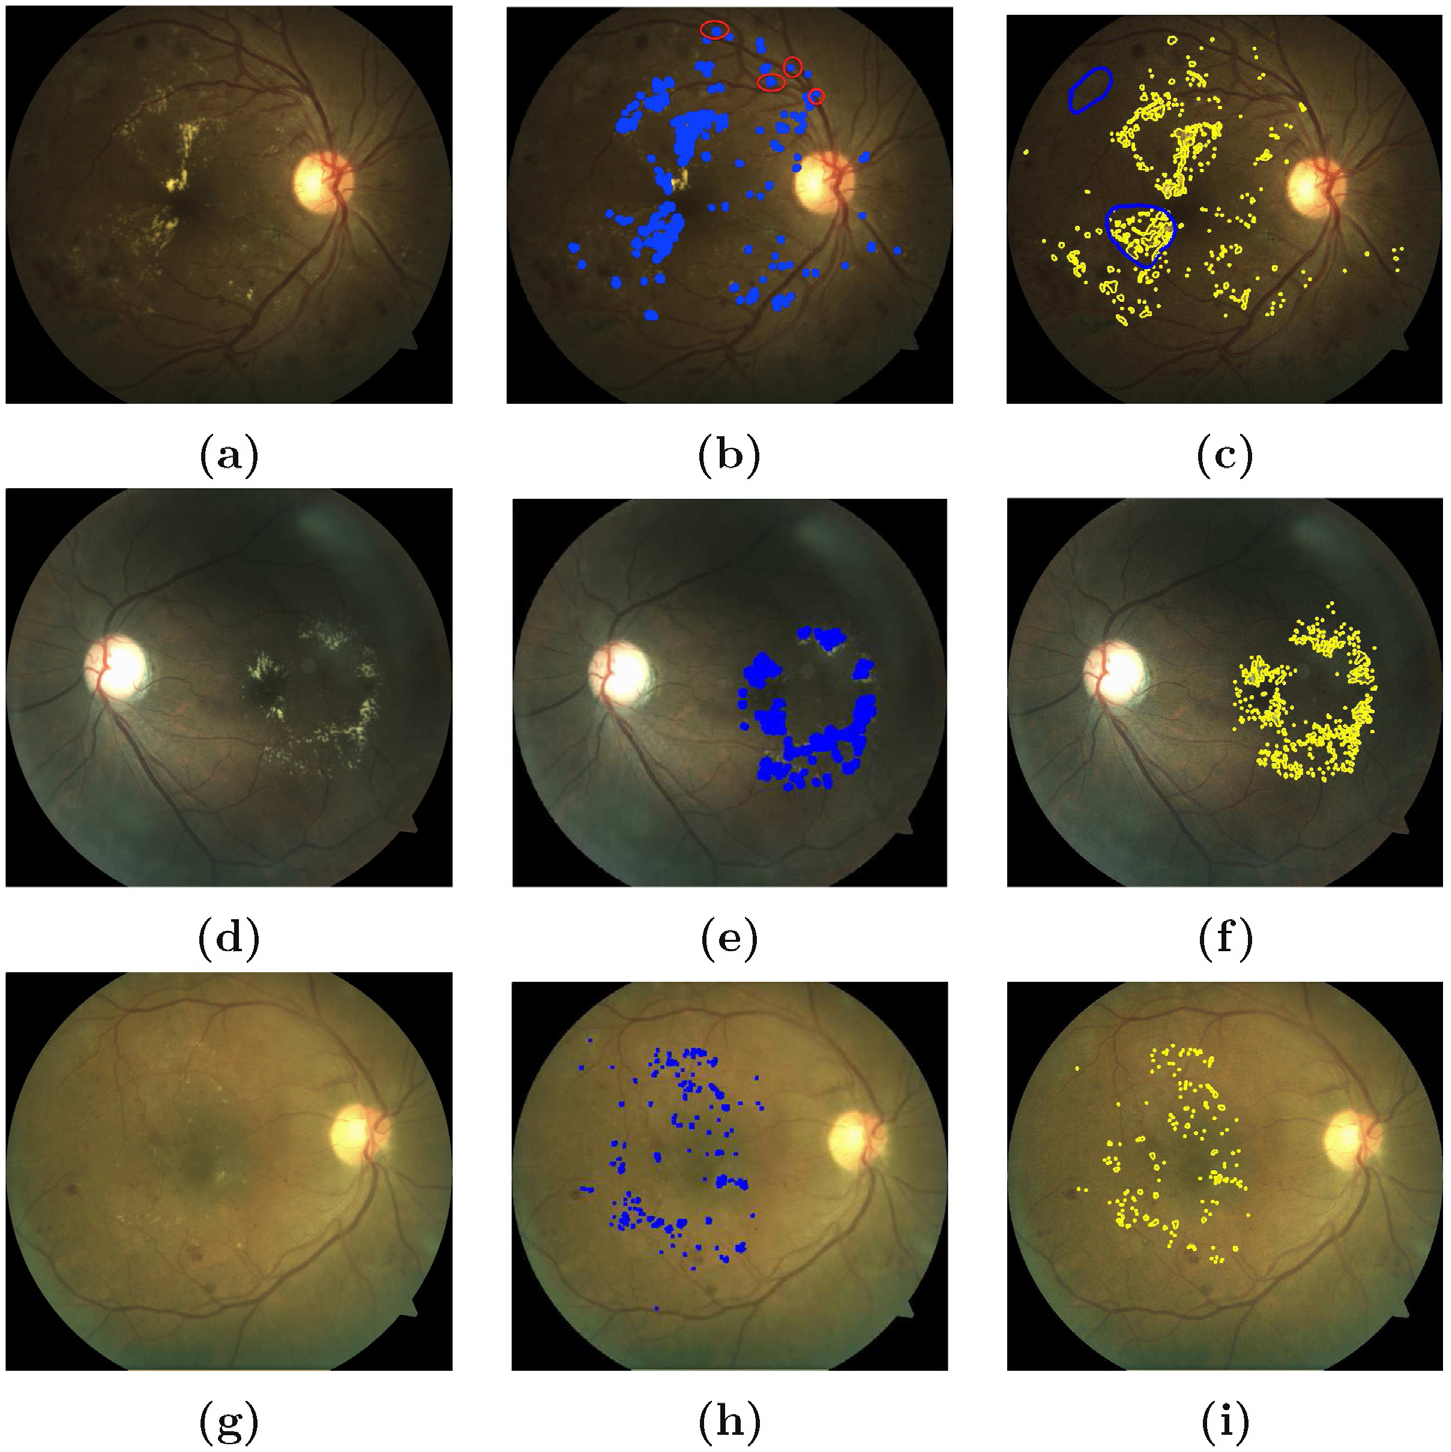
Fig. 11.

Results of exudate segmentation: on the left column (a, d, g) are original images; in middle column (b, e, h) are images with labelled exudates from the output of the algorithm (thres = 0.6) and on the right column (c, f, i) are the ground truths annotated by an ophtalmologist [12]. On the topmost right column (c), the blue circles represent bright lesions which might not be possibly hard exudates. The percentage accuracy for exudate segmentation are 82%, 85% and 89% in (b), (e) and (h) respectively. Strong imaging artefacts as in (a) affected the accuracy of the proposed method. The red circles in (b) shows the FP detections in such conditions.
