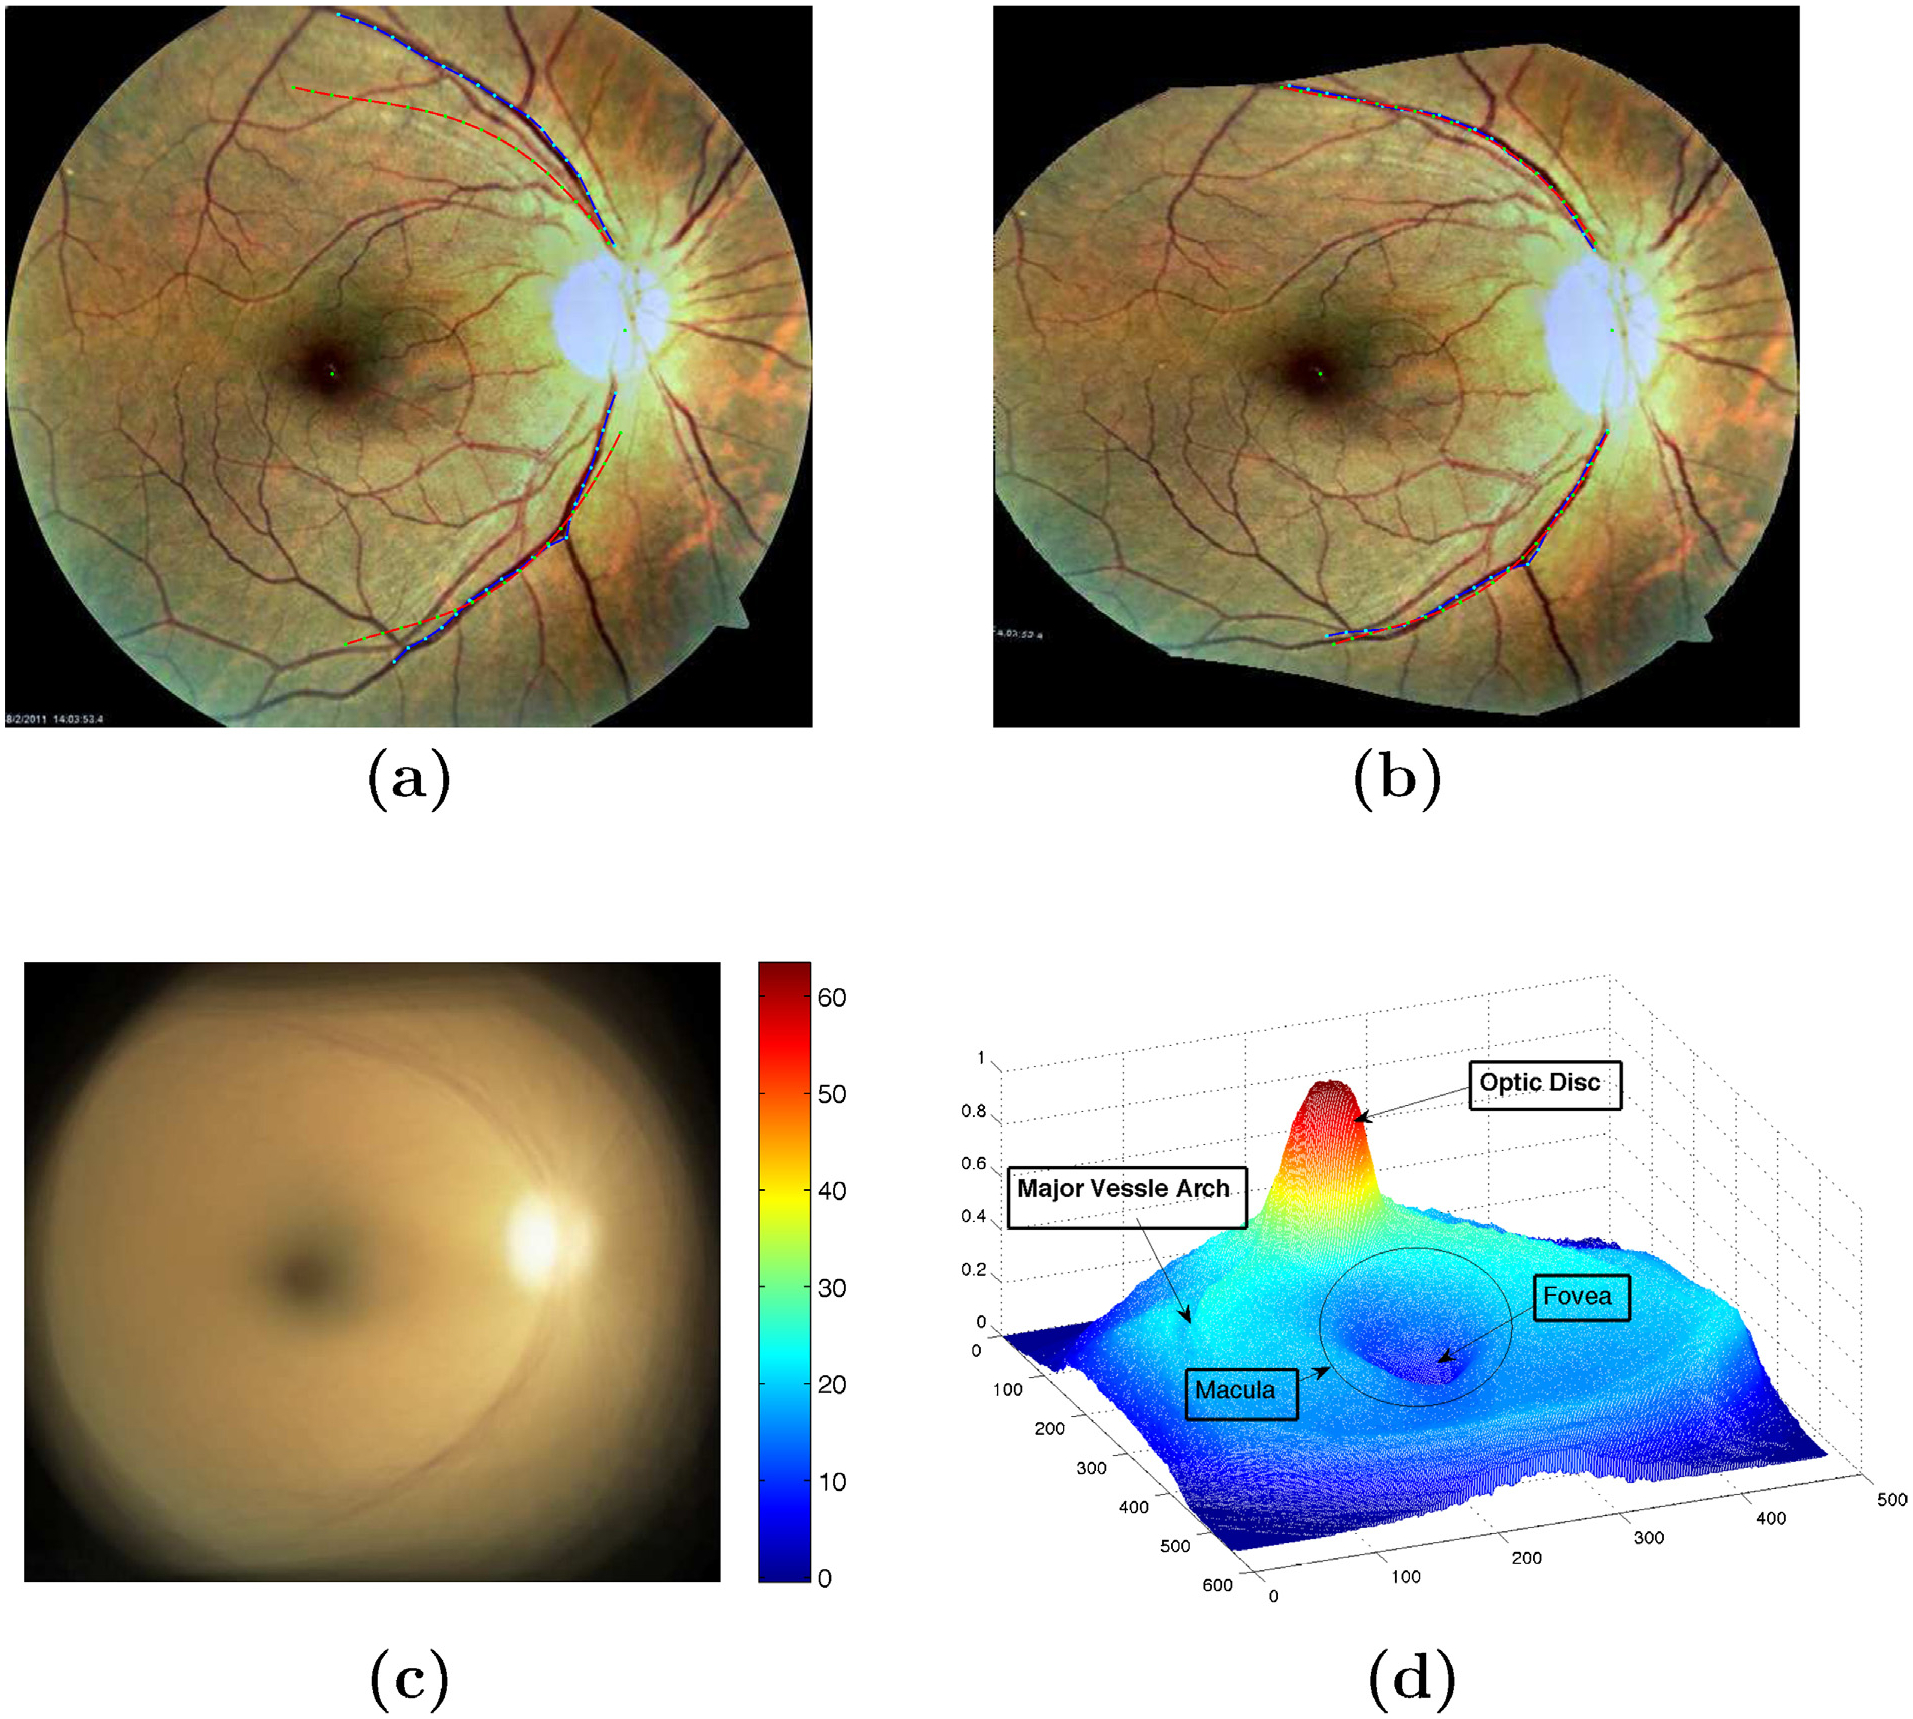
Fig. 5.

Warping of the training images onto atlas co-ordinate. (a) On original image, red line represents the atlas co-ordinate and blue represents the main vessel arches of the image to be warped; (b) Image after warping with thin plate spline to atlas co-ordinate; (c) Mean image of 200 warped images onto atlas space with its chromatic distribution; (d) Statistical atlas image with labelled landmarks.
