Fig. 6.
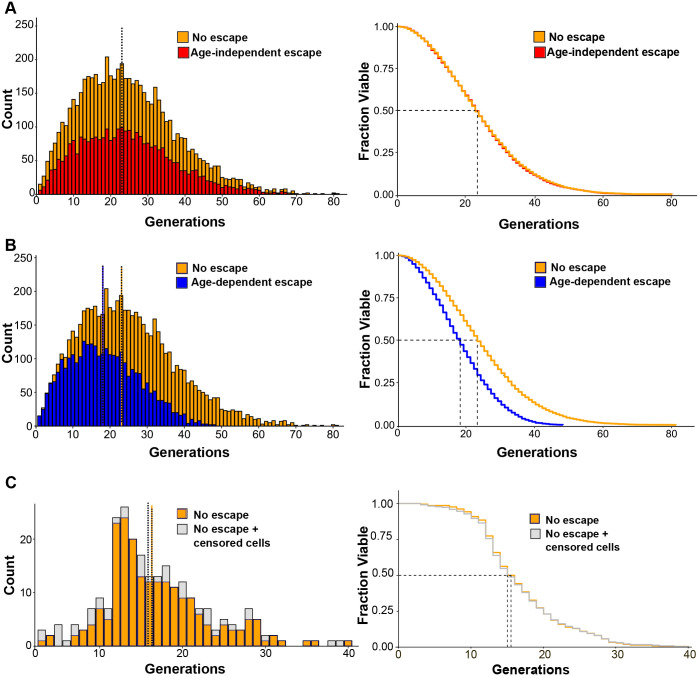
Impact of censored cells on lifespan distributions. (A) Left panel: comparison of lifespan distributions of two simulated cell populations: no escape from chip traps (orange) and age-independent escape (red). An initial population of 6000 cells was considered in both cases. Wilcoxon–Rank sum test P-value=0.7. Right panel: corresponding survival curves. Median lifespans are indicated by dotted lines. (B) Left panel: the lifespan distribution for no escaped cells (orange, same as in A) is compared to the distribution of a simulated cell population where escape probability increases proportionally with age (blue, age-dependent). Wilcoxon–Rank sum test P-value <2.2e−16. Right panel: corresponding survival curves. (C) Left panel: experimentally obtained lifespan distribution of retained cells in an RLS assay of WT cells (n=208 cells) compared to the distribution including both retained and censored cells (n=251). Wilcoxon–Rank sum test P-value=0.30. Right panel: corresponding survival curves.

