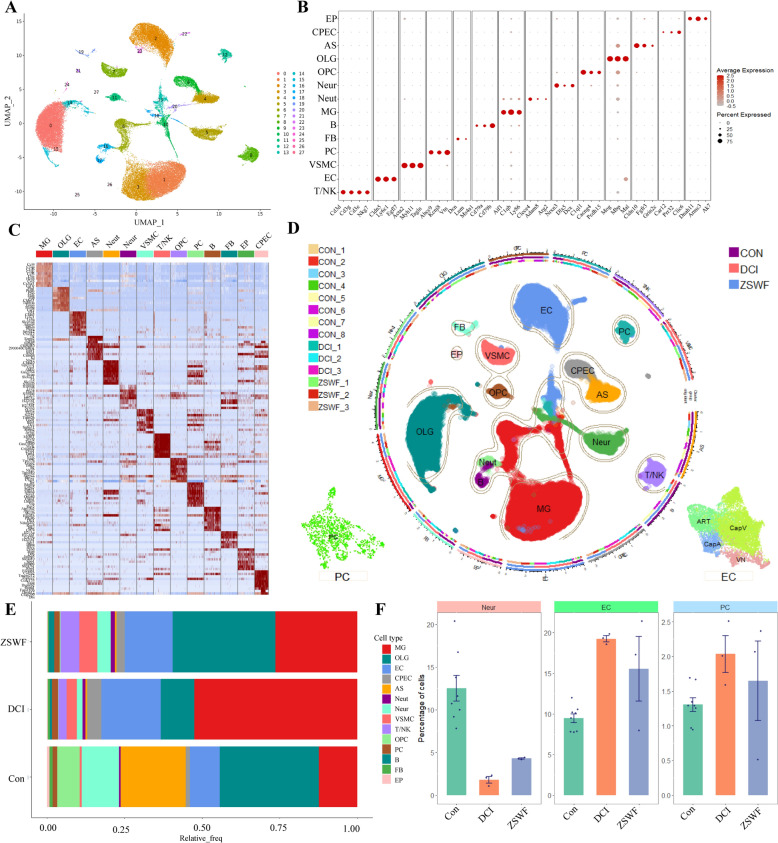
Fig. 3.
Single cell transcriptional landscape of DCI mouse brain treated with ZSWF. A Umap showing the clusters of all high-quality brain cells after reduction and clustering. B Dotplot showing the expression levels of well-known representative cell-type-enriched marker genes across all 14 cell types. C Heatmap showing the top ten most enriched genes for each cell type. D A total of 26,760 high-quality cells from 14 mouse brains in 3 different groups are projected by UMAP plot. Colors indicate the major brain cell types, and cluster boundaries are outlined by contour curve. The illustrations in the bottom two corners insets show endothelial cell subsets and pericytes maps. The axis outside the circular plot depicts the log scale of the total cell number for each cell class. The three colored tracks (from outside to inside) indicate mouse ID, group ID, and marker gene expression. The left legend shows the mouse ID/colors for the mouse ID track. The right legend shows groups ID/colors used for the groups track. E Bar chart showing the percentage of 14 brain cell types in the three groups. F Bar plot showing the percentage of neurons, vascular endothelial cells and pericytes in the three groups, these data were expressed as the mean ± SD of 8 Con, 3 DCI, and 3 ZSWF brains

