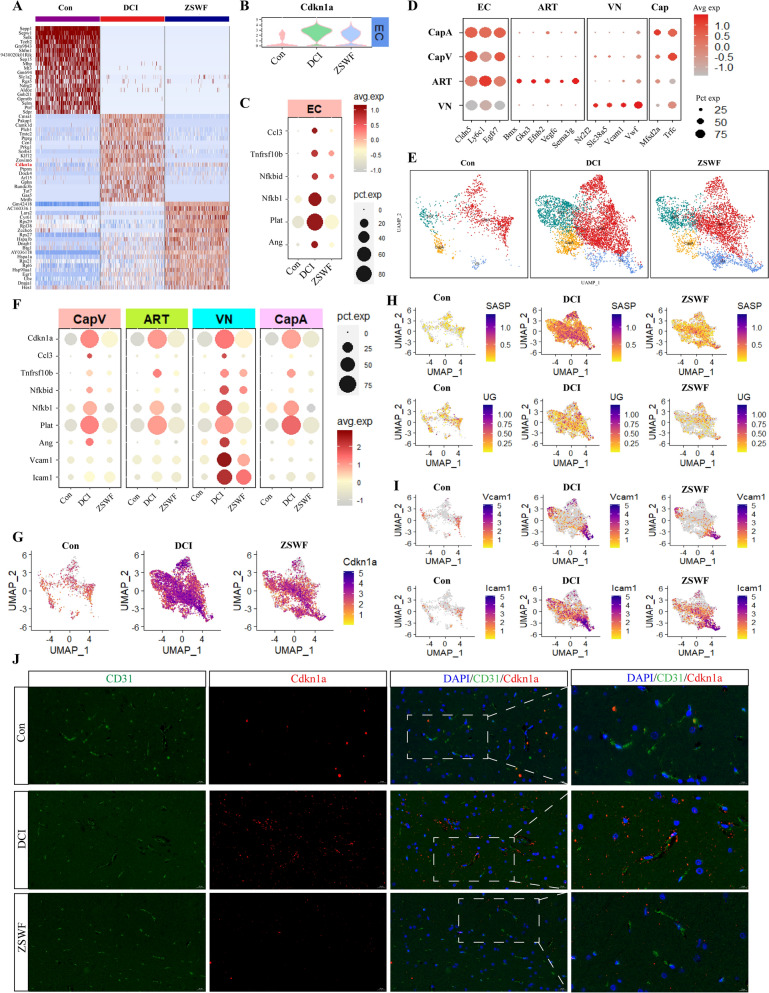
Fig. 4.
ZSWF prevented brain endothelial cells senescence in DCI mice. A Heatmap showing the top 20 most enriched genes for each gruop. B Violin plot showing the distribution of expression levels of Cdkn1a in endothelial cells of each group. C Dotplot showing the expression levels of SASP genes (such as Ccl3, Tnfrsf10b, Nfkbid, Nfkb1, Plat, and Ang) in endothelial cells of each group, the colors on the right of the picture represent the average expression level of these genes, and the circles represent the percentage distribution of these genes in each group of cells. D Dotplot showing the expression levels of well-known representative marker genes in vascular endothelial cells. E Umap showing the distribution of endothelial cell subtypes (ART, arterial endothelial cell; VN, venous endothelial cell; CapA, capillary arterial endothelial cell; CapV, capillary venous endothelial cell) in each group. F Dotplot showing the expression levels of SASP genes (such as Ccl3, Tnfrsf10b, Nfkbid, Nfkb1, Plat, Ang, Vcam1, and Icam1) in each endothelial cell subtype of three groups. G Umap showing the distribution of expression levels of Cdkn1a in endothelial cell subtype of each group. H Umap showing the expression levels of SASP genes set (such as Ccl3, Tnfrsf10b, Nfkbid, Nfkb1, Plat, and Ang) and senescence upstream genes set (such as Kra, Map2k6, Mapk14, and Foxo1) in endothelial cell subtype of each group. I Umap showing the expression levels of leukocyte adhesion molecules (Vcam1 and Icam1) in endothelial cell subtype of each group. J Immunofluorescence depicting the expression of senescence signature proteins (Cdkn1a, red) in endothelial cells (CD31, green) of each group (scale bar, 20 µm)

