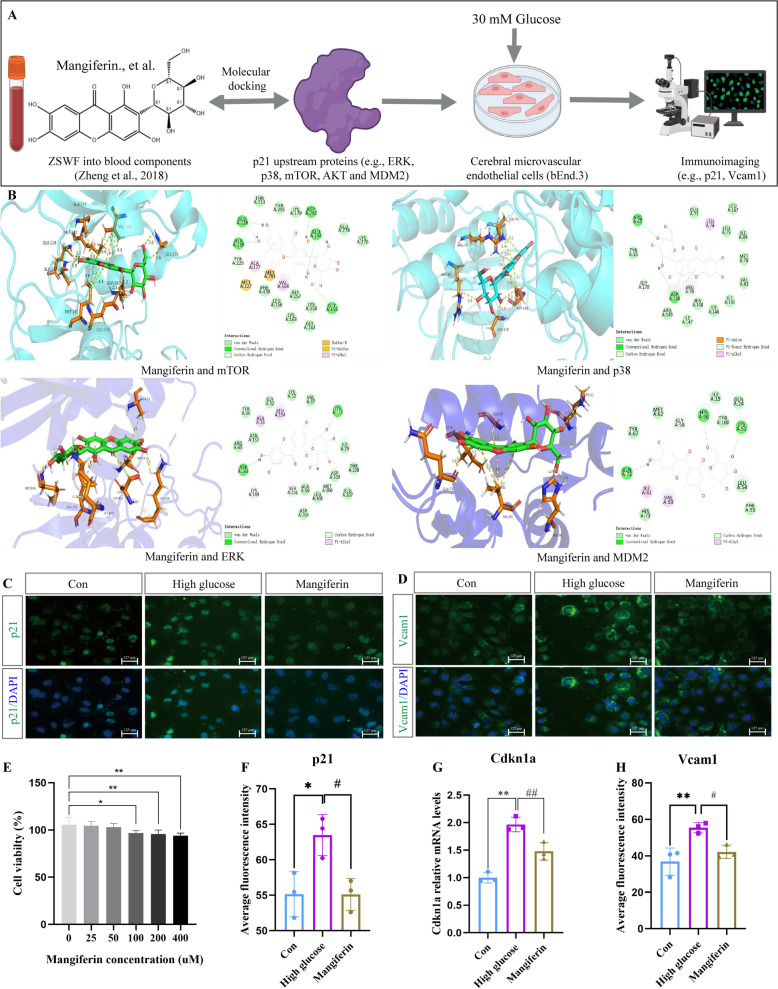
Fig. 6.
Mangiferin prevents endothelial cell senescence induced by high glucose. A Overview of ZSWF anti-vascular senescence active ingredient screening workflow. B Pattern diagram of molecular docking, including mangiferin and mTOR, p38, ERK and MDM2, respectively. C Representative fluorescence imaging of p21 protein expression. D Representative fluorescence imaging of Vcam1 protein expression. E Histogram represents the effects of mangiferin at different concentrations on the cytotoxicity of bEnd.3, this data was expressed as the mean ± SD and analyzed using t-test, n = 6, **P < 0.01, *P < 0.05 vs. 0 µM. F Histogram shows the protein expression level of p21. G Histogram shows the mRNA expression level of Cdkn1a. H Histogram shows the protein expression level of Vcam1. These data were expressed as the mean ± SD, these data were analyzed using one-way ANOVA, n = 3, **P < 0.01, *P < 0.05 vs. Con, ##P < 0.01, #P < 0.05 vs. High glucose

