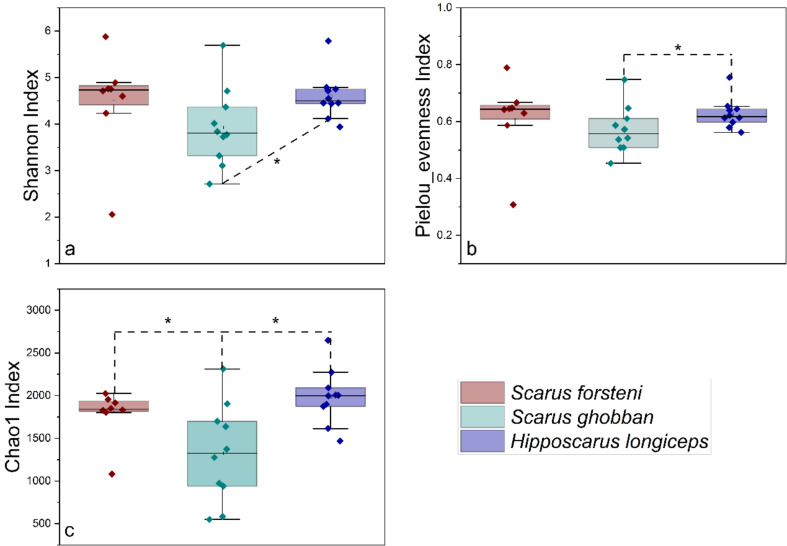
Fig. 3.
Comparisons of four α-diversity indices, Shannon index (a), Pielou evenness index (b), and Chao1 index (c), of the 28 gut specimens from S. forsteni, S. ghobban, and H. longiceps. The significance of the differences was determined using the Wilcoxon rank-sum test. A single asterisk (*) indicates a significant difference at the 0.05 level, a double asterisk (**) indicates a significant difference at the 0.01 level. These results were obtained from the ASVs datasets

