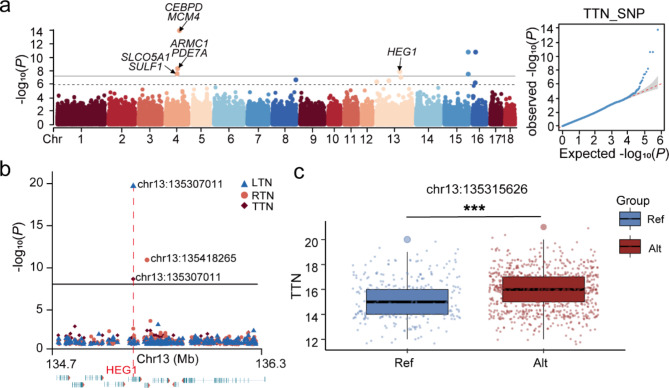
Fig. 2.
GWAS of born teat number based on SNPs and population validation. (a) GWAS of TTN based on SNPs. N = 560 Yorkshire pigs. The horizontal solid line represents Bonferroni threshold (-Log10(0.05/678,204) = 7.1324). The horizontal dashed line represents the suggestive significance threshold line (-Log10(1/678,204) = 5.8314). (b) Magnification of the gene region with significant variants in TTN, RTN and LTN GWAS result. Different color and shaped points distinguish three traits. (c) Population validation in 1169 Yorkshire pigs base on target sequencing with GWAS candidate significant SNP in TTN. The blue box represent sow population with reference variant; and the red box is sow population with mutation

