
Fig. 4.
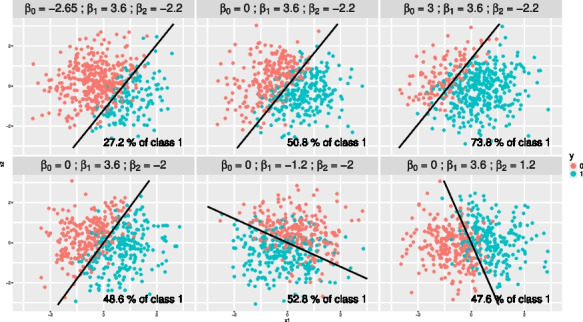
Illustration of data generation with different values of and two features. The straight black line shows the coordinates of points where . The percentage of observations labeled as 1 at the end of the generation procedure is displayed in the bottom-right corner. The top panels depict the class of each observation for varying values of , while and are held constant. The bottom panels show the class of each observation with fixed at zero and, varying values of and