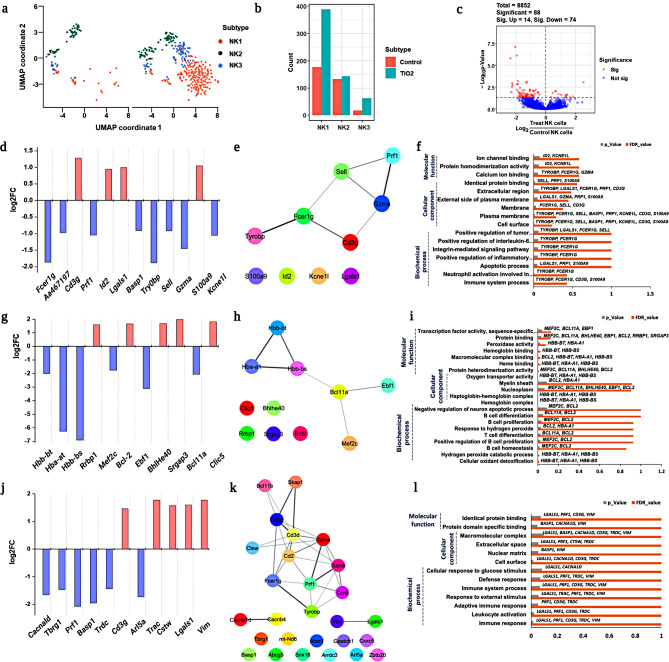
Fig. 4.
In depth profiling of NK cells. (a) UMAP visualization of total NK cells from the treated and untreated groups with subsets identification using PhenoGraph clustering analysis; (b) Population differences in each NK cell subset between the treated and untreated groups; (c) Volcano plot represents DEGs from NK cells with significant and non-significant entries; d, e, f. DEGs, network analysis, and gene ontology enrichment analysis for NK_1 subset were visualized; g, h, i. DEG analysis, the network and gene ontology enrichment analysis of NK_2 subset observed using log2fold changes; j, k, l. DEG analysis, network and GO profiling were observed and visualized for NK_3 subset

