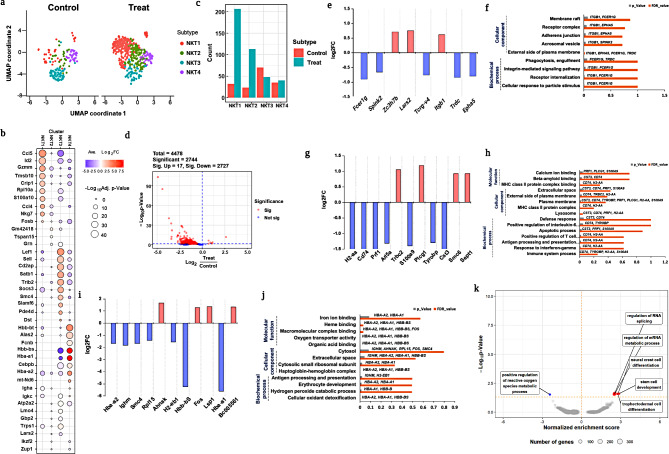
Fig. 5.
Comprehensive analysis profiling of NKT cells. a. UMAP visualization of NKT subset between the treated and untreated groups by PhenoGraph clustering analysis; b. Markers gene expression of NKT subsets; c. Population differences in each subset from NKT cells between the treated and untreated groups; d. Volcano plot depicts significant u and downregulated DEGs; e, f. DEGs from the NKT_2 subset was visualized using log2fold changes, and GO enrichment analysis were also observed; g, h. Similarly, log2fold changes, as well as GO enrichment analysis were used to visualize DEGs in the NKT-2 subset; i, j, DEG analysis for the NKT_3 subset visualized using log2fold changes, and gene ontology enrichment analysis. k. GSEA analysis to predict enrichment score of DEGs genes involved in diff pathways

