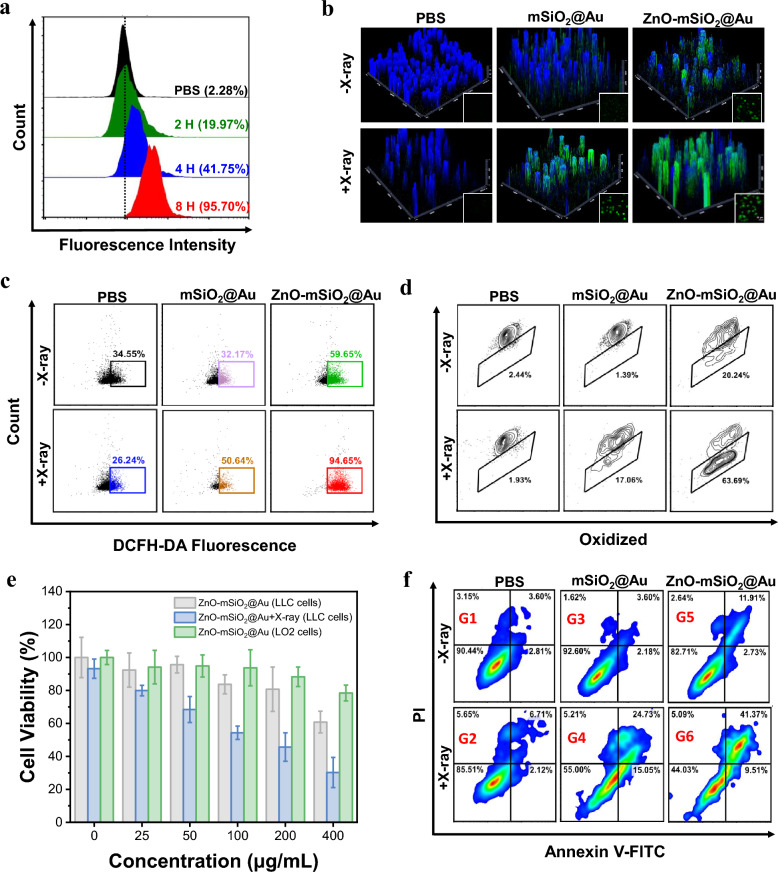
Fig. 2.
In vitro inhibition of tumor cell growth. a Cell uptake on LLC cells incubated with ZnO–Au@mSiO2 analyzed by Flow cytometry at different time. b Intracellular ·OH generation detected by DCFH-DA probe (scale bar, 20 μm). c Flow cytometry data for DCFH-DA probe treated with different therapeutic groups. d Detection of lipid peroxidation by BODIPY-C11 staining in LLC cells incubated with different groups. e Cell viabilities of LLC cells and LO2 cells measured by MTT assays, after incubating with different concentration of ZnO–Au@mSiO2 with or without X-ray. f Flow cytogram representing apoptosis assay based on Annexin V-FITC and propidium iodide staining of LLC cells after treatment with different therapeutic groups. Group 1: PBS, Group 2: PBS + X-ray, Group 3: Au@mSiO2, Group 4: Au@mSiO2 + X-ray, Group 5: ZnO–Au@mSiO2u, Group 6: ZnO–Au@mSiO2 + X-ray

