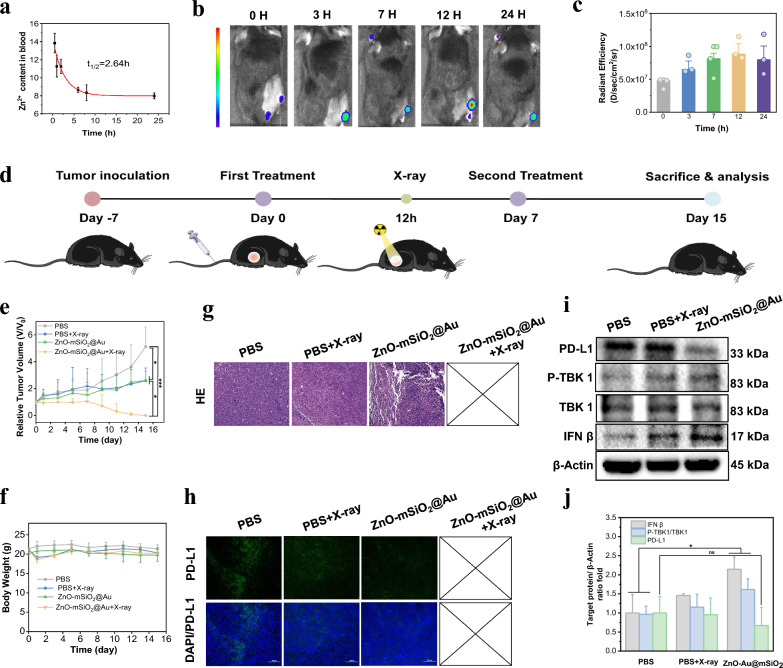
Fig. 5.
In vivo biodistribution and anti-tumor efficacy. a Pharmacokinetics of ZnO–Au@mSiO2. b Fluorescence imaging of mice bearing LLC tumor at 0, 3, 7, 12, 24 h post-injection intravenously of ZnO–Au@mSiO2-Cy5.5 (n = 3). c The corresponding fluorescence signals of subcutaneous tumors at 0, 3, 7, 12, 24 h post-injection intravenously of ZnO–Au@mSiO2-Cy5.5. d Schematic illustration of the treatment process in mice bearing tumor. e The administration of the tumor volume changes in different treatment groups (n = 3) (*p < 0.05, ***p < 0.001). f The administration of mouse body weights in different treatment groups (n = 3). g Representative H&E staining images of tumor tissues collected from group 1, group 2 and group 3 (scale bar, 100 μm). h Immunofluorescence staining of PD-L1 in the tumor slices collected from group 1, group 2 and group 3 (scale bar, 100 μm). i Western blotting analysis for protein expression of PD-L1 and cGAS-STING-associated proteins (IFN β, TBK1 and p-TBK1) in tumor tissues. j The relative protein levels of survivin after different treatments

