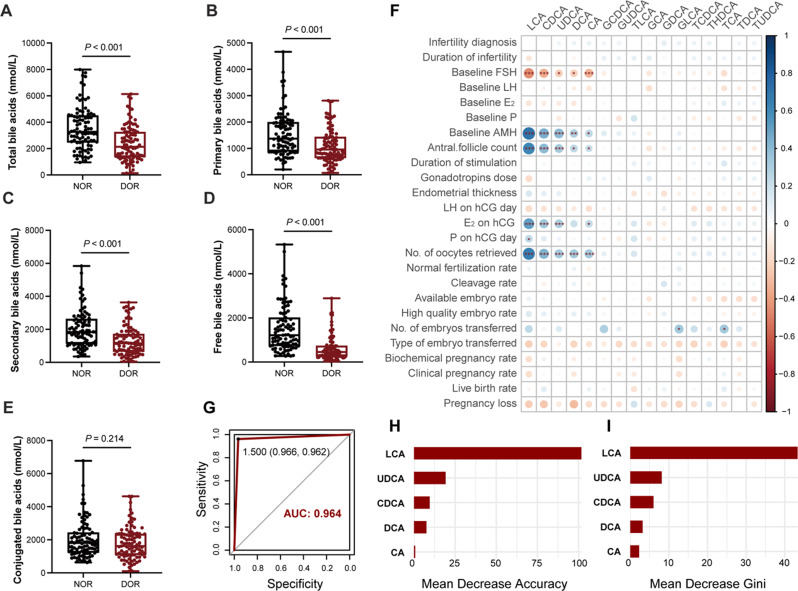
Fig. 1.
Series analysis of bile acid levels in follicular fluid of patients with DOR. Follicular fluid in patients with DOR showed unique bile acid metabolism characteristics. We compared the difference of total bile acids (A), primary bile acids (B), secondary bile acids (C), free bile acids (D) and conjugated bile acids (E) between NOR and DOR. (F) The correlation between bile acid metabolite levels in follicular fluid and clinical characteristics in 182 patients (NOR = 91, DOR = 91), where the size of the dots represents the size of Spearman’s correlation coefficient and significance is marked with *. We constructed a random forest diagnostic model using five bile acids, and plotted the model’s ROC curve and AUC value (G), the mean decrease accuracy and mean decrease in the Gini coefficient of each variable (H,I). NOR = normal ovarian reserve; DOR = diminished ovarian reserve; ROC = receiver operating curve; AUC = area under the curve. * P < 0.05; **P < 0.01; *** P < 0.001

